Ask Statistics and Probability Expert

Description

In the previous assignment you had to mark a multiple-choice exam for 27 students. marks_assignment1.tsv contains the marks of the students.

a) Read the marks from the marks_assignment1.tsv into a data.frame called marks.

b) Write a function called getDegree, which takes as input a mark and returns the degree the student achieved:
- "1st" for marks higher or equal to 70
- "2:1" for marks higher or equal to 60 and lower than 70
- "2:2" for marks higher or equal to 50 and lower than 60
- "3rd" for marks higher or equal to 40 and lower than 50
- "failed" for marks lower than 40
Hint: One of the many ways to do this would be with if statements.

c) Compute the degree for each student and add a new column to the data.frame called degree.

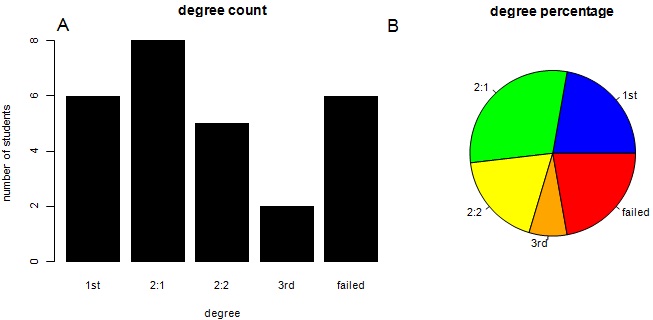
d) Create a plot and save it to a pdf file called degree_statistics.pdf. The plot comprises of two panels on one row. The first panel is a bar graph with the number of students that obtain each degree and the second panel is a pie chart of the same information. Add titles, labels, a letter to identify each panel ("A" and"B") in the top left corner of the panel (outside the plot). Change the colour of the bar plot to black. Used a different colour for each degree: blue for"1st", green for "2:1", yellow for "2:2" orange for "3rd" f and red for "failed"

329_Figure.jpg

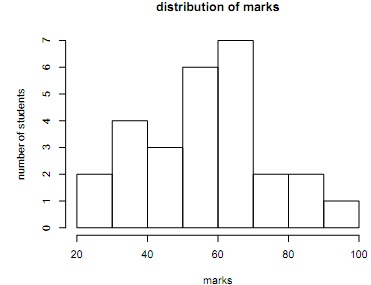
e) Create a histogram with all the marks and save it to a pdf file called marks_hist.pdf. Add titles and labels to the plot.

216_Figure1.jpg

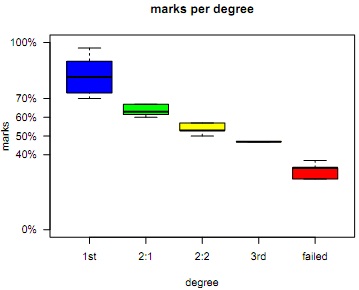
f) Split the marks based on the degree and create a box plot for the marks of each degree (you will have a box plot with 5 boxes, one for each of the degrees). Used a different colour for each degree (same as point d).

Change the y-axis to display horizontally only the levels: "0%", "40%", "50%", "60%", "70%" and "100%". Save this plot into a pdf file called marks_boxplot.pdf.

1407_Figure2.jpg

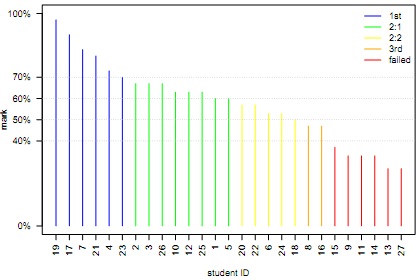
g) Order the data.frame based on the marks in decreasing order. Split the data.frame based on the degree. Plot using vertical bars the marks of every student that obtained a "first".

Hint: look at the type argument of the plot function.

Using a for loop and lines plot the rest of the marks grouped by degrees. Keep the same colour scheme from task d. Add a legend on the top right corner with the degrees and the colour schemes. Add titles and labels to the plot. On x-axis, plot the student id vertically. Add dotted gray lines delimiting the degrees. Change the y-axis as in task f. Save this plot to a pdf file marks_by_degree.pdf

2389_Figure3.jpg

Attachment:- marks_assignment1.rar

Statistics and Probability, Statistics

  • Category:- Statistics and Probability
  • Reference No.:- M92217075
  • Price:- $60

Guranteed 36 Hours Delivery, In Price:- $60

Have any Question?


Related Questions in Statistics and Probability

Introduction to epidemiology assignment -assignment should

Introduction to Epidemiology Assignment - Assignment should be typed, with adequate space left between questions. Read the following paper, and answer the questions below: Sundquist K., Qvist J. Johansson SE., Sundquist ...

Question 1 many high school students take the ap tests in

Question 1. Many high school students take the AP tests in different subject areas. In 2007, of the 144,796 students who took the biology exam 84,199 of them were female. In that same year,of the 211,693 students who too ...

Basic statisticsactivity 1define the following terms1

BASIC STATISTICS Activity 1 Define the following terms: 1. Statistics 2. Descriptive Statistics 3. Inferential Statistics 4. Population 5. Sample 6. Quantitative Data 7. Discrete Variable 8. Continuous Variable 9. Qualit ...

Question 1below you are given the examination scores of 20

Question 1 Below you are given the examination scores of 20 students (data set also provided in accompanying MS Excel file). 52 99 92 86 84 63 72 76 95 88 92 58 65 79 80 90 75 74 56 99 a. Construct a frequency distributi ...

Question 1 assume you have noted the following prices for

Question: 1. Assume you have noted the following prices for paperback books and the number of pages that each book contains. Develop a least-squares estimated regression line. i. Compute the coefficient of determination ...

Question 1 a sample of 81 account balances of a credit

Question 1: A sample of 81 account balances of a credit company showed an average balance of $1,200 with a standard deviation of $126. 1. Formulate the hypotheses that can be used to determine whether the mean of all acc ...

5 of females smoke cigarettes what is the probability that

5% of females smoke cigarettes. What is the probability that the proportion of smokers in a sample of 865 females would be greater than 3%

Armstrong faber produces a standard number-two pencil

Armstrong Faber produces a standard number-two pencil called Ultra-Lite. The demand for Ultra-Lite has been fairly stable over the past ten years. On average, Armstrong Faber has sold 457,000 pencils each year. Furthermo ...

Sppose a and b are collectively exhaustive in addition pa

Suppose A and B are collectively exhaustive. In addition, P(A) = 0.2 and P(B) = 0.8. Suppose C and D are both mutually exclusive and collectively exhaustive. Further, P(C|A) = 0.7 and P(D|B) = 0.5. What are P(C) and P(D) ...

The time to complete 1 construction project for company a

The time to complete 1 construction project for company A is exponentially distributed with a mean of 1 year. Therefore: (a) What is the probability that a project will be finished in one and half years? (b) What is the ...

  • 4,153,160 Questions Asked
  • 13,132 Experts
  • 2,558,936 Questions Answered

Ask Experts for help!!

Looking for Assignment Help?

Start excelling in your Courses, Get help with Assignment

Write us your full requirement for evaluation and you will receive response within 20 minutes turnaround time.

Ask Now Help with Problems, Get a Best Answer

Why might a bank avoid the use of interest rate swaps even

Why might a bank avoid the use of interest rate swaps, even when the institution is exposed to significant interest rate

Describe the difference between zero coupon bonds and

Describe the difference between zero coupon bonds and coupon bonds. Under what conditions will a coupon bond sell at a p

Compute the present value of an annuity of 880 per year

Compute the present value of an annuity of $ 880 per year for 16 years, given a discount rate of 6 percent per annum. As

Compute the present value of an 1150 payment made in ten

Compute the present value of an $1,150 payment made in ten years when the discount rate is 12 percent. (Do not round int

Compute the present value of an annuity of 699 per year

Compute the present value of an annuity of $ 699 per year for 19 years, given a discount rate of 6 percent per annum. As