Ask Question, Ask an Expert

+61-413 786 465

info@mywordsolution.com

Ask Applied Statistics Expert

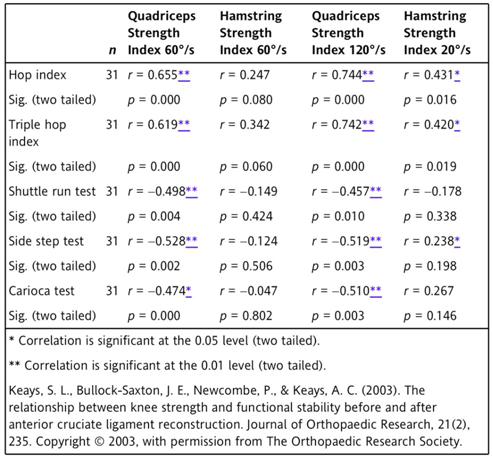
Keays et al. (2003) conducted a correlational study to determine "the relationship between muscle strength and functional stability in 31 patients pre- and postoperatively, following a unilateral anterior cruciate ligament rupture" (Keays et al., 2003, p. 231). The results of the study showed a significant positive correlation between quadriceps strength indices and functional stability, both before and after surgery. No significant relationship was demonstrated between hamstring strength indices 60°/s and functional stability, as presented in Table 5.

Relevant Study Results

"Patients with an unstable knee as a result of an anterior cruciate ligament (ACL) rupture rely heavily on muscle function around the joint to maintain dynamic stability during functional activity. It is uncertain which muscles play the decisive role in functional stability or exactly which aspect of muscle function is most critical" (Keays et al., 2003, p. 231). "The aim of this study was to assess the relationship between muscle strength and functional stability of 31 patients pre- and postoperatively, following unilateral ACL ligament rupture" (Keays et al., 2003, p. 231). "To assess the relationship between maximum isokinetic strength and functional performance Pearson's correlations (r) were computed. ... Due to the number of correlations computed, and therefore the increased likelihood that chance results may be evident, a more conservative significance level of α = 0.01 was adopted to control for increased Type 1 error" (see Table 5; Keays et al., 2003, pp. 232-3).

TABLE 5 Pearson's Product-Moment Correlation between Strength Indices and Function after Surgery n

279_Which of the variables has the strongest relationship.png

Quadriceps Strength Index 60°/s

Hamstring Strength Index 60°/s

Quadriceps Strength Index 120°/s

Hamstring Strength Index 20°/s

Hop index

1. What is the r value for the relationship between Hamstring strength index 60°/s and the Shuttle run test? Is this r value significant? Provide a rationale for your answer.

2. Consider r = 1.00 and r = -1.00. Which r value is stronger? Provide a rationale for your answer.

3. Describe the direction of the relationship between the Hamstring strength index 60°/s and the Shuttle run test.

4. Without using numbers, describe the relationship between the Hamstring strength index 120°/s and the Triple hop index.

5. Which variable has the weakest relationship with the Quadriceps strength index 120°/s? Provide a rationale for your answer.

6. Which of the following sets of variables has the strongest relationship?

a. Hamstring strength index 120°/s and the Hop index

b. Quadriceps strength index 60°/s and the Carioca test

c. Quadriceps strength index 120°/s and the Side step test

d. Quadriceps strength index 60°/s and the Triple hop index

7. In Table 5, two r values are reported as r = -0.498 and r = -0.528. Describe each r value in words, indicating which would be more statistically significant, and provide a rationale for your answer.

8. The researchers stated that the study showed a positive, significant correlation between Quadriceps strength indices and pre- and postoperative functional stability. Considering the data presented in the Table 5, do you agree with their statement? Provide a rationale for your answer.

9. The researchers stated that no significant relationship could be described between Hamstring strength indices 60°/s and functional stability. Given the data in Table 5, explain why not.

10. Consider the relationship reported for the Quadriceps strength index 120°/s and the Hop index (r = 0.744**, p = 0.000). What do these r and p values indicate related to statistical significance and clinical importance?

Applied Statistics, Statistics

  • Category:- Applied Statistics
  • Reference No.:- M9474059
  • Price:- $50

Priced at Now at $50, Verified Solution

Have any Question?


Related Questions in Applied Statistics

Statistics for business decisions assignment assignment 1

Statistics for Business Decisions Assignment Assignment 1 - QUESTION 1 - Time Series Regression The table below presents the number of students attending Statistics lectures in weeks 1 to 10. Week Number of students 1 90 ...

Assignment - statistics in educational researchpart a -

Assignment - Statistics in Educational Research Part A - Show all your work Q1) A teacher asked each of her students how many novels they had read in the previous six months. The results are shown below. 0 1 5 4 2 1 3 2 ...

Enhancing patient safety through organizational learningare

Enhancing Patient Safety through Organizational Learning: Are Patient Safety Indicators a Step in the Right Direction? by Peter E. Rivard, Amy K. Rosen, and John S. Carroll. Take a professional position, from the HIM per ...

Part a -question 1 - an analyst considers to test the order

PART A - Question 1 - An analyst considers to test the order of integration of some time series data. She decides to use the DF test. She estimates a regression of the form Δy t = μ + ψy t-1 + u t and obtains the estimat ...

Medical and applied physiology experimental report

Medical and Applied Physiology Experimental Report Assignment - Title - Compare the working and spatial memory by EEG. 30 students were tested (2 memory games were played to test their memory - a card game and a number g ...

Applied statistics - regression assignmentin this

Applied Statistics - Regression Assignment In this assignment you are expected to set up a regression equation, run that regression and interpret and evaluate the results. You will need to carefully state all null hypoth ...

Linear project instructions -curve-fitting project - linear

Linear Project instructions - Curve-fitting Project - Linear Model For this assignment, collect data exhibiting a relatively linear trend, find the line of best fit plot the data and the line, interpret the slope, and us ...

Question - go to the website national quality forum nqf

Question - Go to the website, National Quality Forum (NQF), located in the Webliography, and download the article by WIRED FOR QUALITY: The Intersection of Health IT and Healthcare Quality, Number 8, MARCH 2008. You are ...

Using minitab statistics to calculate the various

Using Minitab Statistics to calculate the various T-Tests The steps required for completing the deliverables for this assignment (screen shots that correspond to these instructions can be found immediately following them ...

Business data analysis facts from figures assignment

BUSINESS DATA ANALYSIS: FACTS FROM FIGURES Assignment - Question 1 - Private capital expenditure for 12 successive quarters are presented in the following table: Quarter Millions     1 31,920 2 25,120 3 30,350 4 24,650 5 ...

  • 4,153,160 Questions Asked
  • 13,132 Experts
  • 2,558,936 Questions Answered

Ask Experts for help!!

Looking for Assignment Help?

Start excelling in your Courses, Get help with Assignment

Write us your full requirement for evaluation and you will receive response within 20 minutes turnaround time.

Ask Now Help with Problems, Get a Best Answer

Why might a bank avoid the use of interest rate swaps even

Why might a bank avoid the use of interest rate swaps, even when the institution is exposed to significant interest rate

Describe the difference between zero coupon bonds and

Describe the difference between zero coupon bonds and coupon bonds. Under what conditions will a coupon bond sell at a p

Compute the present value of an annuity of 880 per year

Compute the present value of an annuity of $ 880 per year for 16 years, given a discount rate of 6 percent per annum. As

Compute the present value of an 1150 payment made in ten

Compute the present value of an $1,150 payment made in ten years when the discount rate is 12 percent. (Do not round int

Compute the present value of an annuity of 699 per year

Compute the present value of an annuity of $ 699 per year for 19 years, given a discount rate of 6 percent per annum. As