problem 1: Statistics - Inventory Problem
George Madison used to be an accounting professor at a state university. Several years ago, he started to develop seminars and programs for CPA review course. The CPA review course is a course to help accounting students and others interested in passing the CPA exam. In order to develop an effectual seminar, George developed a number of books and other associated materials to help. The major product was the CPA review manual developed by George. The manual was an instant success for his seminars and other seminars and courses across the country. Nowadays, George spends most of his time refining and distributing this CPA review manual. The annual demand is 9,600 and the cost of ordering is $400 per order. The price of manual is $100.00. George’s total cost to manufacture and produce the manual is $80.00. George wants to avoid stockouts and/or to develop a stockout policy which would be cost-effective. If there is a stockout on the CPA review manual, George loses the gain from the sale of manual.
George wants to know how much safety stock he should have as a buffer. George predicts that his carrying cost per unit per year is $12.00. Based on total cost what ROP and what level of safety stock would you propose? The frequency of demand for the CPA review manuals throughout lead time is given in table below.
Table: Frequency Distribution for Demand
Demand During Lead Time Frequency (number of times demanded)
350 3
400 2
450 2
500 4
550 5
600 6
650 5
700 5
750 5
800 3
Complete all of the columns in the given table and elucidate your recommendation.
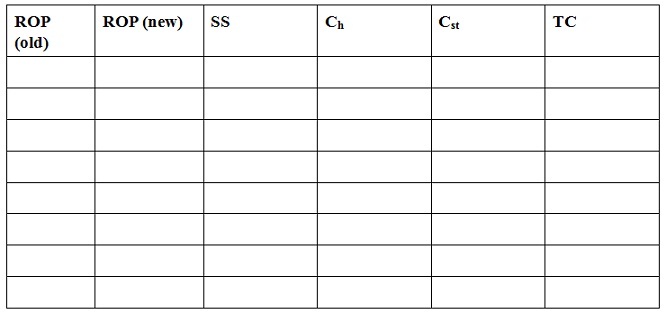
Illustrate all of your work [computations for old ROP, EOQ, N and Cst]
problem 2: Statistics – Project Management
The Department of Interior has named the Saratoga Mountain area a national park. This is in the planning phases of developing a campsite over 500 acres of currently undeveloped land. This campsite will span the extremities of the park, from the proposed Mission Creek Campsite area in the west to Wild Coyote campsite area in the east. Refer to figure shown below.
At this time, all of the contracts for this project have been awarded. The project has been sub-divided into ten individual activities, as shown in table below. Based on similar projects, it has been possible to estimate optimistic times, most probable times and pessimistic times for most activities. Activities F and I are discussed in the given paragraphs.
Activity F, which will be performed by Ellis Electric, includes laying the electrical cable for the project. To minimize its costs, Ellis Electric will design the system to use the least amount of electrical cable. Ellis will charge the government an amount between $100,000 and $200,000. For $100,000, Ellis Electric can assign adequate workers to lay 300 feet of cable per week. For $200,000, Ellis will assign additional workers to lay 500 feet of cable each week. You can find out the number of linear feet based on minimal spanning.
Activity I includes constructing one (narrow) paved two-lane road from Mission Creek in the west to Wild Coyote in the east. This work will be completed by Harriman Construction Company. To minimize the costs, the department will pay Harriman to build the road of minimum distance between the two campsites. At a cost to the government of $25,000 per week, 200 feet of roadway can be done in a week. When the cost is raised to $36,000 per week, the completion rate will raise to 250 feet per week. You can use shortest path to find out the number of linear feet.
Due to the heavy brush and mountainous nature of area, 12 possible dirt paths exist between the campsites. Neither Ellis nor Harriman is allowed to clear out additional regions for constructing either underground cable or the paved road. Therefore, the electrical cable should be laid and the road should be built all along areas of the dirt paths. Figure below provides a map of the possible dirt paths between campsites showing distances in feet.
The grand opening of Saratoga Mountain National Park has been schedule for precisely 62 weeks from now. This is imperative that the project be done within the 62-week period because a delay of even one day in the opening of the park would outcome in revised travel costs for the dignitaries, lost income to the park and other expenses.
The Normal Cost column in table below represents how much an activity would cost if completed in the expected time. The Crash Cost column symbolizes the additional cost that would be accrued if the activity was crashed the maximum amount possible.
The Normal Time will be expected time you compute for each activity. The Max Crash Time symbolizes the maximum amount by which an activity could be crashed. For illustration if the expected time for an activity is 12 weeks and the maximum crash time is 2 weeks that signifies that the activity could be crashed to 10 weeks however no more.
i) Compute and show the expected times and variances for each activity [A, B, C, D, E, G, H, J]. Determine times for F and I based on your computations of linear feet.
ii) Construct the PERT network for this problem.
iii) Create an Activity Schedule [that is, table showing ES, EF, LS, LF, slack] for the four options.
iv) What are the actions on the critical path for each option? Describe your answer.
v) What is the expected completion time for each and every option?
vi) What is the total cost for each option?
vii) Based on the costs and times determined for the four options devoid of crashing, which one would you propose? describe.
viii) What is the standard deviation of the critical path in part (iv) in each option? Based on your recommendation in part (vi), what is the probability of completing the project at most one week more than the expected time?
ix) Based on your recommendation given in part (viii), would you propose crashing any actions to meet the 62-week deadline? Describe your decision.
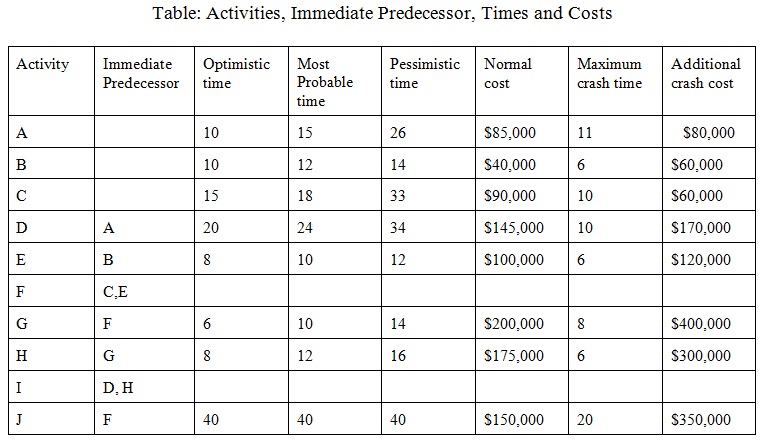
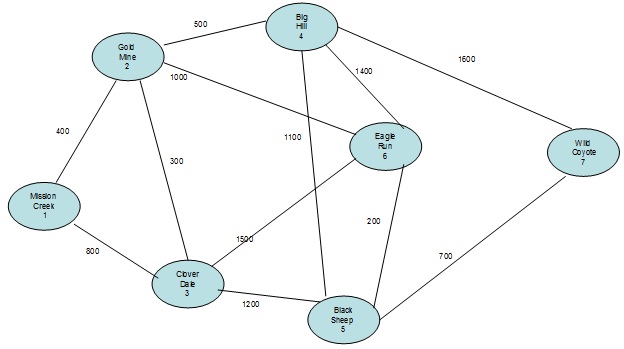
Figure: Saratoga mountain national park