Complete a descriptive analysis of the following data elements in the Organizational Assessment Study dataset. Use appropriate graphical tools and descriptive statistics to characterize each element. Refer to Table 1 in the McHugh text (2003) for some suggestions on the types of information you should consider for your analysis.
1. Region: Coverage region
2. Skill Level: Highest level of driver certification
3.Training10: Hours of training, as of 2010
4. Survey10_1: Satisfied with job, as of 2010
5. Year10: Number of years driver has been with the company, as of 2010
Organizational Assessment Study - Data Collection Plan
The population of interest is the total assigned drivers for the Huffman Trucking Company. The population is approximately 925 drivers. Data from the population will be collected to assess the effectiveness of Huffman's training program and drivers' job and policy satisfaction.
Iwamoto • Crews • Coe will collect three general types of data for the Huffman Trucking Organizational Assessment Study: demographic, performance, and assessment.
Demographic Data
Demographic data are collected to describe the population, identify subgroups in the population, and compare subgroups based on performance and assessment data.
The required demographic data should exist in company personnel files. The following data elements will be collected for this study:
1. Employee ID
2. Driver's gender
3. Region in which driver is based
4. Salary for 2010
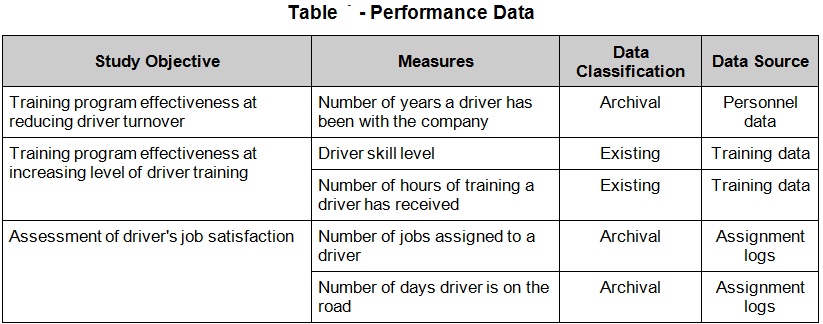
Performance Data
Performance data are objective output data collected to determine the effectiveness of the Huffman Trucking training program.
Performance data may be existing, archival, or generated. A review of Huffman Trucking records shows that all performance measures are currently collected, so no data must be generated.
The study objectives and performance measures used to quantify them are shown in Table 1.
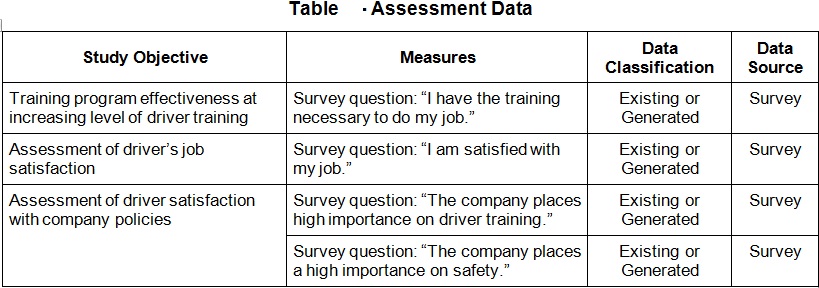
Assessment Data
Assessment data are subjective output data collected to determine driver perceptions regarding the job and Huffman Trucking Company policies.
Assessment data is typically existing, archival, or generated. For this study, there is no archival data. Data from 2009 exists due to a survey administered in that year. Data for 2010 must be generated. The same survey administered in 2009 will generate 2010 data.
The study objectives and performance measures used to quantify them are shown in Table 2.
Organizational Assessment Study Data Descriptors
EmployeeID: These are unique identifiers between 5101 and 8199
Gender: Male (0) or Female (1)
Skill Level: This is the highest skill level of a driver. The data are integers from the set {0, 1, 2, 3, 4} coded as follows:
0 – Driver Trainee
1 – Light Truck Driver
2 – Route Driver
3 – Heavy Truck Driver
4 – Long Distance Driver
Region: This is the region in which the driver is based. The data are integers from the set {0, 1, 2, 3} coded as follows:
0 – Cleveland
1 – Los Angeles
2 – St. Louis
3 – Bayonne
Salary10: Employee salary at the end of 2010
Travel10: The number of days a driver is on the road in 2010
Violations09: The number of violations found during compliance spot checks of the driver's vehicle at company facilities, divided by the number of spot checks, in 2009
Violations10: The number of violations found during compliance spot checks of the driver's vehicle at company facilities, divided by the number of spot checks, in 2010
Training09: The number of hours of training the employee had in 2009
Training10: The number of hours of training the employee had in 2010
NumJobs09: The number of jobs a driver was assigned in 2009
NumJobs10: The number of jobs a driver was assigned in 2010
The following data elements were taken from a survey asking employees about aspects of their job and training. The survey was given to employees at the end of 2009 and again at the end of 2010. The respondents were asked to rate their agreement with a statement using a five-point Likert-type scale:
1. Strongly agree
2. Agree
3. Neither agree nor disagree
4. Disagree
5. Strongly disagree
Data from responses to the 2009 survey:
Survey09_1 – Responses to the statement: "The company places high importance on driver training."
Survey09_2 – Responses to the statement: "I have the training necessary to do my job."
Survey09_3 – Responses to the statement: "My job requires too much travel."
Data from responses to the 2010 survey:
Survey10_1 – Responses to the statement: "The company places high importance on driver training."
Survey10_2 – Responses to the statement: "I have the training necessary to do my job."
Survey10_3 – Responses to the statement: "My job requires too much travel."