Ask Statistics and Probability Expert

Case Study presented data on the fastest speed that men and women had driven a car, and dotplots were shown for each sex. Data for the men are also in the pennstate1M dataset on the companion website.
a. Create a stem-and-leaf plot for the male speeds.

b. Create a histogram for the male speeds.

c. Compare the pictures created in (a) and (b) and the dotplot in Case Study. Comment on which is more informative, if any of them are, and comment on any other differences that you think are important.

d. How would you describe the shape of this dataset?

Case Study
Who Are Those Speedy Drivers?
A survey taken in a large statistics class at Penn State University contained the question "What's the fastest you have ever driven a car? mph." The data provided by the 87 males and 102 females who responded are listed here.

2047_Data 1.jpg

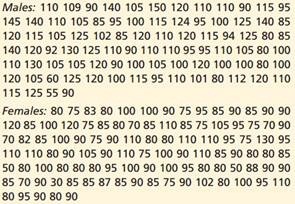
From these numbers, can you tell which sex tends to have driven faster and by how much? Notice how difficult it is to make sense of the data when you are simply presented with a list. Even if the numbers had been presented in numerical order, it would be difficult to compare the two groups.

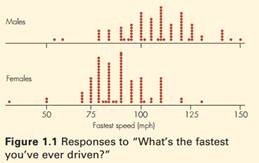
Your first lesson in statistics is how to formulate a simple summary of a long list of numbers. The dotplot shown in Figure 1.1 helps us see the pattern in the data. In the plot, each dot represents the response of an individual student. We can see that the men tend to claim a higher "fastest ever driven" speed than do the women.

The graph shows us a lot, and calculating some statistics that summarize the data will provide additional insight. There are a variety of ways to do so, but for this example, we examine a five-number summary of the data for males and females. The five numbers are the lowest value; the cut-off points for one-fourth, one half, and three-fourths of the data; and the highest value. The three middle values of the summary (the cutoff points for one-fourth, one-half, and three fourths of the data) are called the lower quartile, median, and upper quartile, respectively. Five-number summaries can be represented like this:

2231_Graph 5.jpg


Males (87 Students)

Female (102 Students)

Median

110

89

Quartiles

95

120

80

95

Extremes

55

150

30

130

Some interesting facts become immediately obvious from these summaries. By looking at the medians, you see that half of the men have driven 110 miles per hour or more, whereas the halfway point for the women is only 89 miles per hour. In fact, three-fourths of the men have driven 95 miles per hour or more, but only one fourth of the women have done so. These facts were not at all obvious from the original lists of numbers.

Moral of the Story: Simple summaries of data can tell an interesting story and are easier to digest than long lists.

Definitions: Data is a plural word referring to numbers or nonnumerical labels (such as male/female) collected from a set of entities (people, cities, and so on). The median of a numerical list of data is the value in the middle when the numbers are put in order. For an even number of entities, the median is the average of the middle two values. The lower quartile and upper quartile are (roughly) the medians of the lower and upper halves of the data.

Statistics and Probability, Statistics

  • Category:- Statistics and Probability
  • Reference No.:- M92209150

Have any Question?


Related Questions in Statistics and Probability

Introduction to epidemiology assignment -assignment should

Introduction to Epidemiology Assignment - Assignment should be typed, with adequate space left between questions. Read the following paper, and answer the questions below: Sundquist K., Qvist J. Johansson SE., Sundquist ...

Question 1 many high school students take the ap tests in

Question 1. Many high school students take the AP tests in different subject areas. In 2007, of the 144,796 students who took the biology exam 84,199 of them were female. In that same year,of the 211,693 students who too ...

Basic statisticsactivity 1define the following terms1

BASIC STATISTICS Activity 1 Define the following terms: 1. Statistics 2. Descriptive Statistics 3. Inferential Statistics 4. Population 5. Sample 6. Quantitative Data 7. Discrete Variable 8. Continuous Variable 9. Qualit ...

Question 1below you are given the examination scores of 20

Question 1 Below you are given the examination scores of 20 students (data set also provided in accompanying MS Excel file). 52 99 92 86 84 63 72 76 95 88 92 58 65 79 80 90 75 74 56 99 a. Construct a frequency distributi ...

Question 1 assume you have noted the following prices for

Question: 1. Assume you have noted the following prices for paperback books and the number of pages that each book contains. Develop a least-squares estimated regression line. i. Compute the coefficient of determination ...

Question 1 a sample of 81 account balances of a credit

Question 1: A sample of 81 account balances of a credit company showed an average balance of $1,200 with a standard deviation of $126. 1. Formulate the hypotheses that can be used to determine whether the mean of all acc ...

5 of females smoke cigarettes what is the probability that

5% of females smoke cigarettes. What is the probability that the proportion of smokers in a sample of 865 females would be greater than 3%

Armstrong faber produces a standard number-two pencil

Armstrong Faber produces a standard number-two pencil called Ultra-Lite. The demand for Ultra-Lite has been fairly stable over the past ten years. On average, Armstrong Faber has sold 457,000 pencils each year. Furthermo ...

Sppose a and b are collectively exhaustive in addition pa

Suppose A and B are collectively exhaustive. In addition, P(A) = 0.2 and P(B) = 0.8. Suppose C and D are both mutually exclusive and collectively exhaustive. Further, P(C|A) = 0.7 and P(D|B) = 0.5. What are P(C) and P(D) ...

The time to complete 1 construction project for company a

The time to complete 1 construction project for company A is exponentially distributed with a mean of 1 year. Therefore: (a) What is the probability that a project will be finished in one and half years? (b) What is the ...

  • 4,153,160 Questions Asked
  • 13,132 Experts
  • 2,558,936 Questions Answered

Ask Experts for help!!

Looking for Assignment Help?

Start excelling in your Courses, Get help with Assignment

Write us your full requirement for evaluation and you will receive response within 20 minutes turnaround time.

Ask Now Help with Problems, Get a Best Answer

Why might a bank avoid the use of interest rate swaps even

Why might a bank avoid the use of interest rate swaps, even when the institution is exposed to significant interest rate

Describe the difference between zero coupon bonds and

Describe the difference between zero coupon bonds and coupon bonds. Under what conditions will a coupon bond sell at a p

Compute the present value of an annuity of 880 per year

Compute the present value of an annuity of $ 880 per year for 16 years, given a discount rate of 6 percent per annum. As

Compute the present value of an 1150 payment made in ten

Compute the present value of an $1,150 payment made in ten years when the discount rate is 12 percent. (Do not round int

Compute the present value of an annuity of 699 per year

Compute the present value of an annuity of $ 699 per year for 19 years, given a discount rate of 6 percent per annum. As