Ask Question, Ask an Expert

+61-413 786 465

info@mywordsolution.com

Ask Applied Statistics Expert

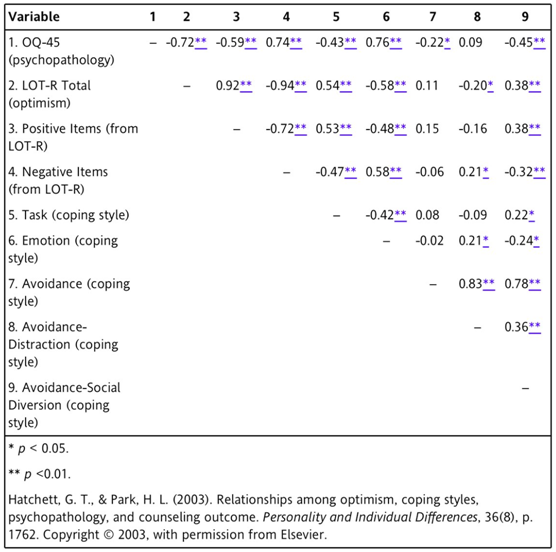
In Table 2 in p. 175, Hatchett and Park (2004) presented the correlations among optimism (LOT-R Total and Positive Items); pessimism (Negative Items); psychopathology (OQ-45); and coping styles (Task, Emotion, Avoidance, Avoidance-Distraction, and Avoidance-Social Diversion). Table 2 is a mirror-image table with the variables numbered and labeled on the y-axis and the numbers of the variables on the x-axis. The blank spaces in the table are where the variable is correlated with itself and would be a +1.00 correlation.

1. What is the r value listed for the relationship between variables 4 and 9?

2. Describe the correlation r = -0.32** using words. Is this a statistically significant correlation? Provide a rationale for your answer.

3. Calculate the percentage of variance explained for r = 0.53. Is this correlation clinically important? Provide a rationale for your answer.

4. According to Table 2, r = 0.15 is listed as the correlation between which two items? Describe this relationship. What is the effect size for this relationship, and what size sample would be needed to detect this relationship in future studies?

5. Calculate the percentage of variance explained for r = 0.15. Describe the clinical importance of this relationship.

6. Which two variables in Table 2, have the weakest correlation, or r value? Which relationship is the closest to this r value? Provide a rationale for your answer.

7. Is the correlation between LOT-R Total scores and Avoidance-Distraction coping style statistically significant? Is this relationship relevant to practice? Provide rationales for your answers.

8. Is the correlation between variables 9 and 4 significant? Is this correlation relevant to practice? Provide a rationale for your answer.

9. Consider two values, r = 0.08 and r = -0.58. Describe them in relationship to each other. Describe the clinical importance of both r values.

10. Examine the Pearson r values for LOT-R Total, which measured Optimism with the Task and Emotion Coping Styles. What do these results indicate? How might you use this information in your practice?

BONUS QUESTION

One of the study goals was to examine the relationship between optimism and psychopathology. Using the data in Table 2, formulate an opinion regarding the overall correlation between optimism and psychopathology. Provide a rationale for your answer.
985_Examine the relationship between optimism and psychopathology.png

Applied Statistics, Statistics

  • Category:- Applied Statistics
  • Reference No.:- M9474070
  • Price:- $60

Guranteed 36 Hours Delivery, In Price:- $60

Have any Question?


Related Questions in Applied Statistics

Business statistics assignment -the purpose of this

Business Statistics Assignment - The purpose of this assignment is to improve your understanding in choosing between and using methods to assess the relationship between variables and make comparisons across different se ...

Linear project instructions -curve-fitting project - linear

Linear Project instructions - Curve-fitting Project - Linear Model For this assignment, collect data exhibiting a relatively linear trend, find the line of best fit plot the data and the line, interpret the slope, and us ...

Assignment -for each of the prompts below report the

Assignment - For each of the prompts below, report the appropriate degrees of freedom, t statistic, p-value and plot using the statistical software platform of your choice (R/STATA) 1) A sample of 12 men and 14 women hav ...

Business analytics and statistics research reportthis

Business Analytics and Statistics Research Report This assignment is based on fictional data. You are creating a business report for the CEO of a retail company called, Athlete Panda. It must be professional in presentat ...

Question 1 for the prostate data set fit a model with lpsa

Question 1. For the prostate data set, fit a model with lpsa as the response, and the other variables as predictors. (a) Suppose a new patient with the following values arrives: lcavol = 1.45000, lweight = 3.59801, age = ...

Analysis - comparing group means background and objectives

Analysis - Comparing group means Background and objectives - The balance_FALL17.xlsx dataset represents data from a fictitious study that explores the impact of two different interventions designed to help elderly client ...

Question - go to the website national quality forum nqf

Question - Go to the website, National Quality Forum (NQF), located in the Webliography, and download the article by WIRED FOR QUALITY: The Intersection of Health IT and Healthcare Quality, Number 8, MARCH 2008. You are ...

Business statistics project assignment -there will be two

BUSINESS STATISTICS PROJECT ASSIGNMENT - There will be two parts to this assignment: Part A: Group Work (A Business Report) Part B: Individual Reflective Piece (A Ministerial Brief) The response to Part A must be provide ...

Assessment task -you become interested in the non-skeletal

Assessment Task - You become interested in the non-skeletal effects of vitamin D and review the literature. On the basis of your reading you find that there is some evidence to suggest that vitamin D deficiency is linked ...

Construct a regression model for predicting total charges

Construct a regression model for predicting total charges from length of stay for DRG 105. a. State the null and alternative hypotheses and alpha level. b. Prepare a scatter diagram with the regression line for the two v ...

  • 4,153,160 Questions Asked
  • 13,132 Experts
  • 2,558,936 Questions Answered

Ask Experts for help!!

Looking for Assignment Help?

Start excelling in your Courses, Get help with Assignment

Write us your full requirement for evaluation and you will receive response within 20 minutes turnaround time.

Ask Now Help with Problems, Get a Best Answer

Why might a bank avoid the use of interest rate swaps even

Why might a bank avoid the use of interest rate swaps, even when the institution is exposed to significant interest rate

Describe the difference between zero coupon bonds and

Describe the difference between zero coupon bonds and coupon bonds. Under what conditions will a coupon bond sell at a p

Compute the present value of an annuity of 880 per year

Compute the present value of an annuity of $ 880 per year for 16 years, given a discount rate of 6 percent per annum. As

Compute the present value of an 1150 payment made in ten

Compute the present value of an $1,150 payment made in ten years when the discount rate is 12 percent. (Do not round int

Compute the present value of an annuity of 699 per year

Compute the present value of an annuity of $ 699 per year for 19 years, given a discount rate of 6 percent per annum. As