ASSIGNMENT
PART A
Answer questions 1-7 using Stata and the dataset "lowbwt2.dta" which has the following variables:
|
Variable
|
Description
|
|
sbp
|
Systolic blood pressure
|
|
sex
|
Gender ( = Male, = Female)
|
|
tox
|
Toxemia diagnosis for mother ( = Yes, = No)
|
|
grmhem
|
Germinal matrix hemorrhage ( = Yes, = No)
|
|
gestage
|
Gestational age
|
|
apgar5
|
Apgar score at five minutes
|
1) How many observations are in the dataset?
2) What type of variable is apgar5? Give an example of a dichotomous variable in the dataset.
3) Produce a histogram of Systolic Blood Pressure with the normal curve overlaid.
4) Which statement is the most accurate? Use any graphical method to make your assessment.
a. The distribution of systolic blood pressure has a very skewed non-normal distribution
b. Apart from a few outliers, the distribution of systolic blood pressure is approximately normally distributed
c. The distribution of systolic blood pressure is extremely skewed with several large outliers
d. The distribution of systolic blood pressure is approximately uniform
5) Babies with an APGAR score of 8 at 5 minutes are generally considered to be in good health. Babies with a score less than 8 may need immediate special care.
Generate a new variable ‘apgarcat' which classifies the babies into two categories: those with an APGAR score of 8 or more and those with an APGAR score of less than 8. Show the Stata code used to create the variable.
6) What percentage of babies might need immediate special care i.e. have an APGAR score of less than 8?
7) Create a 2x2 contingency table of tox by apgarcat with row and column percentages. What percentage of babies born to mothers with a toxemia diagnosis had an APGAR score of less than 8?
PART B
The distribution of gestational age at birth is approximately normally distributed. A random sample of 14 infants who had fetal surgery for congenital anomalies has a mean gestational age of 29.6 weeks and a standard deviation of 3.6 weeks.
8) What percentage of infants would be expected to have a gestational age of more than 35 weeks?
9) What percentage of infants would be expected to have a gestational age of between 26 and 33 weeks?
10) We would expect approximately 99% of the babies to have a gestational age that falls between [?] weeks and [?] weeks.
PART C
Patients with a Body Mass Index (BMI)>30 presenting to primary care physicians in England were randomly assigned to receive either a referral to a weight management support group or some advice about the health benefits of weight loss. The primary outcome was weight change in kilograms.
The following result was reported from the study:
"Weight loss at 12 months, the primary outcome, was 2.43 kg (SD 6.49) for the support group and 1.04 kg (5.50) for the advice group, giving a difference of 1.43 kg (95% CI 0.89-1.97, p<0.0001)."
From: Aveyard et. al., Screening and brief intervention for obesity in primary care: a parallel, two-arm, randomised trial, Lancet 388, 2016 (http://dx.doi.org/10.1016/S0140-6736(16)31893-1)
11) What does the p-value of p<.0001 indicate?
a. There is insufficient evidence to support the null hypothesis that there is no difference in weight loss between the support and advice groups
b. There is sufficient evidence to support the alternate hypothesis that there is a difference in weight loss between the support and advice groups
c. There is sufficient evidence to accept the null hypothesis that there is no difference in weight loss between the support and advice groups
d. There is insufficient evidence to accept the null hypothesis that there is no difference in weight loss between the support and advice groups
12) What type of probability distribution would be appropriate if the researchers decided to look at the proportion of participants who lost at least 1kg?
PART D
Patients with uncomplicated acute rhinosinusitis were recruited and randomly assigned receive either a 10-day course of amoxicillin or a placebo control to test whether there was a reduction in symptoms between the groups.
From: Garbutt et. al, Amoxicillin for Acute Rhinosinusitis, JAMA 307(7), 2012
Questions 11-14 refer to the following table.
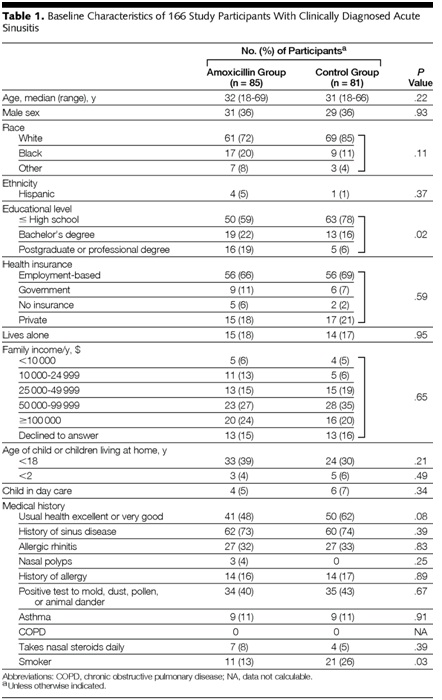
13) Which of the characteristics showed a statistically significant difference between the groups at baseline at a significance level of 5%?
14) How many characteristicsare being tested in this table? Explain why it is inappropriate to present p-values in this context.
15) True or False: The groups are different with regards to baseline characteristics, indicating a problem with the randomisation
16) Recreate a 2x2 contingency table of Sex by Group(in Stata or otherwise) showing row and column totals and column percentages. What is the overall number and proportion of females in the study?
PART E
The following is an excerpt from:
Brown et. al., Morbidity and mortality in patients randomised to double-blind treatment with a long-acting calcium-channel blocker or diuretic in the INSIGHT study, Lancet 356, 29 July 2000.
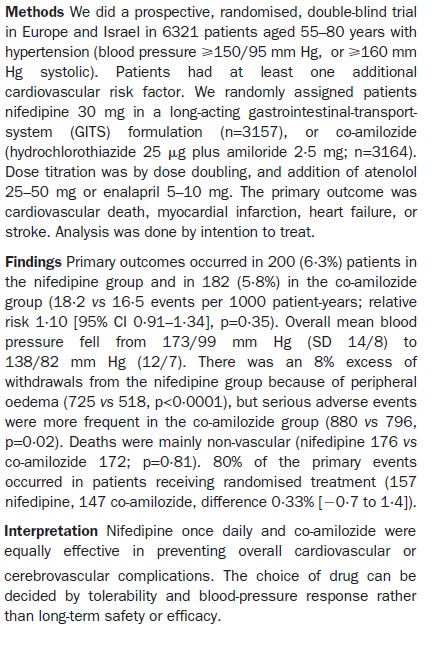
17) What were the proportions of patients with primary outcomes in the nifedipine group and co-amilozide group?
18) Which of the following are true (multiple answers)
a. The study was underpowered due to small sample size.
b. The primary outcome was not significant (p=0.35).
c. The interpretation is correct: There is no evidence of a difference in primary outcome between the two drug groups therefore the drugs are equivalently effective in treating hypertension
d. The interpretation is incorrect: there is no evidence of a difference in primary outcome but this does not imply the drugs are equivalently effective in treatment hyptertension.
Attachment:- lowbwt2.rar