Assignment
Q1. Simple Probability
For each of the following questions, compute the probability of randomly selecting a case from the data set provided below (next page) with the target variable attribute
Tips:
1. The data set below is the same as the one provided in Assignment A-1 last week, so you may use the same Excel file provided last week to work with the data points.
2. This is a simple probability question, pertaining only to the dataset you have in the above table. The question has nothing to do with calculating z or finding proportions in the z table.
3. Sorting the target variable for each question can help to ensure that the tally or calculation is done correctly. You may want to review the tips on sorting data in Excel in Assignment A-1, if you are new to Excel.
Information about the variables:
Age group
- 1: 25 and under
- 2: 26-30
- 3: 31-35
- 4: 36-40
- 5: older than 40
ASU class
- 1: Freshman; 2: Sophomore; 3: Junior; 4: Senior
Work hours
- Number of hours working on a job outside of home
Statistics grade
- Total number of points earned in PSY230, possible grades: 1 to 1000
AZ resident
- 1: Resident in AZ; 0: Not resident in AZ
Sleep duration:
- Average amount of sleep per night in hours during the past month
|
Sub ID
|
Age Group
|
ASU Class
|
Work hours
|
Statistics grade
|
AZ resident
|
Sleep Duration
|
|
1
|
1
|
4
|
40
|
859
|
1
|
7
|
|
2
|
3
|
4
|
40
|
773
|
1
|
8
|
|
3
|
1
|
3
|
40
|
930
|
0
|
6
|
|
4
|
2
|
2
|
30
|
741
|
0
|
5
|
|
5
|
1
|
2
|
40
|
975
|
1
|
6
|
|
6
|
1
|
3
|
40
|
123
|
1
|
8
|
|
7
|
1
|
3
|
15
|
864
|
1
|
8
|
|
8
|
1
|
3
|
30
|
932
|
1
|
7
|
|
9
|
4
|
4
|
35
|
811
|
0
|
6
|
|
10
|
4
|
4
|
40
|
723
|
1
|
6
|
|
11
|
1
|
2
|
25
|
811
|
0
|
8
|
|
12
|
5
|
2
|
20
|
745
|
1
|
8
|
|
13
|
1
|
3
|
15
|
599
|
0
|
7
|
|
14
|
1
|
2
|
40
|
934
|
0
|
6
|
|
15
|
2
|
3
|
20
|
705
|
0
|
6
|
|
16
|
1
|
4
|
20
|
801
|
0
|
8
|
|
17
|
1
|
3
|
40
|
814
|
0
|
9
|
|
18
|
4
|
3
|
0
|
944
|
0
|
6
|
|
19
|
1
|
3
|
0
|
860
|
1
|
6
|
|
20
|
1
|
3
|
40
|
940
|
1
|
7
|
|
21
|
4
|
3
|
15
|
923
|
0
|
7
|
|
22
|
2
|
4
|
40
|
853
|
0
|
7
|
|
23
|
1
|
3
|
20
|
764
|
0
|
8
|
|
24
|
1
|
2
|
35
|
513
|
1
|
9
|
|
25
|
1
|
3
|
30
|
721
|
0
|
9
|
|
26
|
1
|
3
|
20
|
801
|
1
|
6
|
|
27
|
3
|
2
|
40
|
853
|
1
|
7
|
|
28
|
4
|
4
|
15
|
816
|
1
|
7
|
|
29
|
2
|
4
|
25
|
814
|
0
|
7
|
|
30
|
1
|
2
|
40
|
844
|
0
|
6
|
|
31
|
3
|
4
|
40
|
948
|
0
|
8
|
|
32
|
3
|
3
|
0
|
988
|
1
|
9
|
|
33
|
2
|
4
|
0
|
786
|
1
|
7
|
|
34
|
3
|
2
|
40
|
839
|
0
|
8
|
|
35
|
1
|
3
|
40
|
814
|
0
|
7
|
|
36
|
3
|
4
|
40
|
739
|
1
|
6
|
|
37
|
1
|
3
|
40
|
637
|
1
|
5
|
|
38
|
3
|
3
|
40
|
749
|
0
|
6
|
|
39
|
3
|
3
|
20
|
731
|
0
|
9
|
|
40
|
1
|
2
|
40
|
813
|
1
|
7
|
a) Probability of drawing a person who sleeps at least 7 hours on average
b) Probability of drawing a person who works 20 or more hours per week.
c) Probability of drawing a person who failed the statistics course by earning fewer than 600 points (variable Statistics Grade)
d) Which Class (freshman, sophomore, junior, senior) has the highest probability of being drawn from the group of subjects
e) Probability of drawing a person older than 25 years
Q2. Proportions (percentages) in a Z Distribution
In a previous section of PSY230, the second exam was worth 100 points. The scores from that class were normally distributed with a mean (μ ) of 75 and a standard deviation (σ) of 10. If the exam scores were converted to a Z distribution, the distribution would form a perfect bell shape. The following questions require locating individual scores on the Z distribution and examine the percentage (or proportion) of cases above or below a score.
Hints: It helps to draw a Z distribution (bell curve) and place John's and Tom's Z scores on the distribution for answering the questions. Use the Z table for converting between Z score and area (percentage) of the distribution.
a) John obtained a score of 90. What is John's z score?
b) What is the percentage of the students that scored higher than John?
c) If 60 students were in that class, how many of them scored lower than John's score?
d) Tom obtained a score of 70. What is Tom's z score?
e) What is the percentage of students that scored between John and Tom?
f) There are 60 students in the class, so how many of them would likely score lower than Tom?
g) Anna only knows that she scores at 80th percentile on this exam, what is her z score?
h) Based on the result of the previous question, what would be Anna's actual score on the exam?
Q3. Z Distribution: From Probabilities to Proportions (percentages)
Hint: It would be helpful to review the tutorial videos on "how to use the Z table" before answering the following questions.
Answer the following questions with this scenario:
School A wanted to establish a new gifted math program for sixth graders so they administered a standardized math aptitude test to all sixth graders. The school determined that students scoring in the top 5% would be considered exceptional in math abilities so they would be included in the gifted program. The graph below illustrates the area of the Z distribution where students' performance would be considered "significantly better" than the general sixth-grader population.
a) What is the probability of randomly drawing one of those exceptional students from the whole pool of sixth graders in the school?
b) If the school tested 500 students (this means that the whole distribution contains 500 student scores), how many would be identified as meeting this criterion of having exceptional math abilities (who scored significantly higher than the general sixth grade population)?
c) If your child, Katie, scored at 97th percentile on this test, would she be selected for the gifted program? Why or why not?
d) If we use a Z distribution to represent the students' test scores, what is the Z score that serves as the critical (or cutoff) value for this "significance" area of the distribution?
e) Out of all the sixth graders' test scores, the mean (μ) was 100 and the standard deviation (σ) was 15. Based on the critical Z score (from question d above) for the significance area of the distribution, what would be the minimum raw score required for entering the gifted program?
f) As mentioned before, Katie scored at the 97th percentile on this test. What was Katie's actual (raw) test score?
Q4. Z Distribution: From Probabilities to Proportions
Hint: It would be helpful to review the tutorial videos on "how to use the Z table" before answering the following questions.
Answer the following questions with this scenario:
School district B would like to promote awareness of the students' BMI (body mass index) and encourage parents of students with extremely high or extremely low BMI to work with the school nurse in improving their children's BMI and general health. The school district decides to measure all students' BMIs and then identify the highest 10% and the lowest 10% within the district to follow up with their parents. The graph below demonstrates the areas in the BMI distribution for the parent follow-ups.
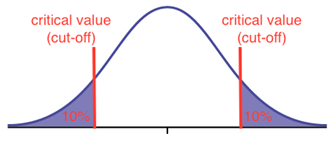
a) If we randomly draw one student out of the school district, what is probability of that child having a BMI that is either in the highest 10% or the lowest 10% of the distribution?
b) If the BMI distribution is converted into a Z distribution, what would be the upper critical Z value and the lower critical Z value that mark the two extremes?
c) If Lindsay's BMI is converted into a Z score of -.3, what is the probability of drawing a student out of the school district that has a Z score that is equal or lower than Lindsay's Z score?
d) If the school district has a total of 5000 students (which means the whole distribution contains 5000 BMI scores), how many of them would have a BMI that is equal to or lower than Lindsay's BMI? (1 pt for formula/work, 1 pt for answer)
e) If the school district sets the higher and lower cut-off points at Z values of +2 and -2, will the school nurse have more students or fewer students to follow up with, compared to the original cut-offs of 10% at either extreme of the distribution? (1 pt for answer, 1 pt for rationale/calculation).
Attachment:- Assignment Files.rar