Assignment Instructions -
Description - This quiz contains questions based on Topics 5 to 8 and requires you to use various dataset(s) and R Commander.
The dataset(s) are attached to the relevant questions. Please click on link (file name) to download the data.
QUESTION 1 - For which of the following correlations would the data points be clustered most closely around the regression line?
a. r = +0.54
b. There is no relationship between the correlation and how close the points are to the regression line.
c. r = +0.81
d. r = -0.87
e. r = 0.00
QUESTION 2 - A one way analysis of variance is used to evaluate the mean differences for a research study comparing 4 treatments with a separate independent sample of n = 5 subjects in each treatment. If the data produce an F-ratio of F = 3.576, then which of the following is the correct statistical decision?
a. There is not enough information to make a statistical decision.
b. Reject the null hypothesis with either a = .05 or a = .01.
c. Fail to reject the null hypothesis with either a = .05 or a = .01.
d. Reject the null hypothesis with a = .05 but not with a = .01.
QUESTION 3 - Four residual plots are shown labelled A, B, C and D. Match the plots to answers below choosing the plot that matches best. Note that if you are having difficulty seeing the plot then please use this pdf ?le fourResidualPlots_V2.pdf.
Which residual plot indicates that for simple linear regression, linearity and constant variance assumption are reasonable?
Which residual plot indicates that for simple linear regression, a log transformation of the outcome variable is required?
Which residual plot indicates that for simple linear regression, an outlier is present?
Which residual plot indicates that a non-linear model would be a better ?t?
a. Figure C
b. Figure D
c. Figure B
d. Figure A
QUESTION 4 - Which of the following is not a characteristic of a nonparametric test? Please choose all that apply.
a. A numerical score is required for each individual.
b. The hypotheses concern population means and variances.
c. The test requires assumptions about the population means or variances.
d. None of the above.
QUESTION 5 - A researcher was comparing several groups of male subjects to examine the effect of exercise on mean BMI change following 12 weeks of exercise. The researcher obtained an F-ratio of 3.67 with df = 2, 43 from an independent-measures One Way ANOVA. Assuming there are no missing values, what is the total number of subjects N employed in the study?
a. N = 46
b. N = 45
c. N = 64
d. N = 43
QUESTION 6 - A researcher was comparing several groups of male subjects to examine the effect of exercise on mean BMI change following 12 weeks of exercise. The researcher obtained an F-ratio of 3.67 with df = 2, 43 from an independent-measures One Way ANOVA. Assuming there are no missing values, what is the total number of treatment groups G being compared in the study?
a. G = 3
b. G = 43
c. G = 2
d. G = 4
QUESTION 7 - A researcher was comparing several groups of male subjects to examine the effect of exercise on mean BMI change following 12 weeks of exercise. The researcher obtained an F-ratio of 3.67 with df = 2, 43 from an independent-measures One Way ANOVA. What is the p-value for the F-test rounded to 3 decimal places? Please provide your answer to three decimal places as X.XXX.
QUESTION 8 - A researcher was comparing several groups of male subjects to examine the effect on diet on mean BMI change following 12 weeks of exercise. The researcher obtained an F-ratio of 3.67 with df = 2, 43 from an independent-measures One Way ANOVA. Using the p-value obtained previously, which of the following statements (if any) is true?
a. There is a statistically significant difference at the 5% level which can be interpreted as that at least one of the group means is different.
b. There is a statistically significant difference at the 5% level which can be interpreted as all the group means are the same.
c. There is not a statistically significant difference at the 5% level which can be interpreted as all the group means are the same.
d. There is not a statistically significant difference at the 5% level which can be interpreted as that at least one of the group means is different.
QUESTION 9 - A study was conducted to compare the effects of a diet and exercise intervention on a group of 251 subjects. Blood pressure for these patients was classified as either 'Normal' or 'Pre-High' at Baseline and again 6 months after the intervention. The raw data is available in A2_2018_Sem1_bpIntervention.csv
Provide 1. a summary table. 2. a very brief write up of the statistical analysis and summary paragraph for a journal article.
Hints: modifying and rerunning some R syntax may be required. For short answer questions, only briefly provide the information necessary to answer the question.
QUESTION 10 - The sample data for a chi-square test are called_____.
a. observed proportions
b. expected proportions
c. observed frequencies
d. expected frequencies
QUESTION 11 - The critical region for a hypothesis test consists of ______.
a. outcomes that have a high probability if the null hypothesis is true.
b. outcomes that have a high probability whether or not the null hypothesis is true.
c. outcomes that have a very low probability if the null hypothesis is true.
d. outcomes that have a very low probability whether or not the null hypothesis is true.
QUESTION 12 - A researcher is examining the relationship between pill colour preferences and gender. A sample of 54 men and 36 women is obtained and each person is asked to identify his/her preference between two choices of packaging for a new generic version of a commonly used tablet. For this sample, 21 of the men preferred packaging A, and 9 of the women preferred packaging A. If a chi-square test is used to evaluate the relationship, what is the expected frequency for women preferring packaging A?
a. 30
b. 18
c. 9
d. 12
QUESTION 13 - The two-by-two table above examines the relationship between obesity and subsequent myocardial infarction. The cells show a number of observed and expected results. Three observed and three expected values are missing. Fill in the missing values. Report your values to ONE DECIMAL PLACE -- XXX.X, XX.X or XX.X etc.
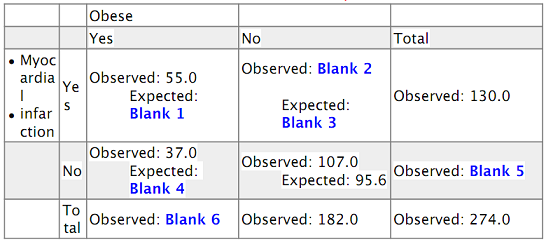
QUESTION 14 - Using the information from the previous questions, a chi squared test was run to determine the association between obesity and myocardial infarction. What is the test statistic rounded to TWO DECIMAL PLACES XX.XX or X.XX?
QUESTION 15 - What is the number of degrees of freedom for this chi squared statistic? Report your answer as a whole number.
QUESTION 16 - What is the p-value for this chi squared statistic? Report your answer to THREE DECIMAL PLACES X.XXX. Please note that if you find a suitably small value of p and decide to report p as p<0.001 (or similar), then this must be reported as <0.001.
QUESTION 17 - Using the Chi Squared test above for obesity by myocardial infarction contingency table and a significance level of 0.05, does this p-value lead us to accept or reject the null hypothesis?
a. Accept null hypothesis, there is no relationship between obesity and myocardial infarction.
b. Reject null hypothesis, there is a relationship between obesity and myocardial infarction.
c. Reject null hypothesis, there is no relationship between obesity and myocardial infarction.
d. Accept null hypothesis, there is a relationship between obesity and myocardial infarction.
QUESTION 18 - A chi-square test for independence is used to evaluate the relationship between two variables. If one variable is classified into 5 categories and the other variable is classified into 3 categories, then the chi-square statistic will have
a. df = 15
b. df = 3
c. df = 8
d. df = 5
e. There is insufficient information to answer this question.
QUESTION 19 - Data were collected on 326 girls aged 10-15 from Gold Coast, Queensland included height and forced expiratory volume (FEV). You are asked to analyse the relationship between the predictor variable, the boys height and the outcome variable their FEV using a simple linear regression. PLEASE MATCH THE QUESTION ITEMS ON THE LEFT WITH THEIR RELEVANT CONCEPTS FROM THE ANSWER ITEMS ON THE RIGHT. ANSWER ITEMS CAN BE USED MORE THAN ONCE.
FEV
Height
Linearity
There should be at least 5 observations in each cell.
Normality of the outcome variable
Normality of the predictor variable
Normality of the residuals
a. Assumption of simple linear regression
b. Not an assumption of simple linear regression
c. Independent variable
d. Dependent Variable
QUESTION 20 - A medical centre approaches you and wants you to investigate the difference in cholesterol levels in milligrams per deciliter of blood (mg/dL) between patients at day 2 and day 14 in a group of patients following a heart attack. Cholesterol is measured in two groups (Controls and Patients following a Heart Attack) at days 2, 7 and 14 days. What is an appropriate statistical test to analyse this relationship for patients following a heart attack?
McNemar's test
Independent samples t-test
Simple linear regression
Correlation
Chi square
Paired t-test
Attachment:- Assignment Files.rar