Assignment -
Problem 1 - Suppose the time elapsed in hours before an event occurs can be modeled with the random variable C which has density function f(c) = c/18, 0 ≤ c ≤ 6.
a) Verify that f(c) is a valid PDF. What criteria do you have to check?
b) Derive the moment generating function MC(t), noting any restrictions on the variable t that might be necessary.
c) Using your moment generating function in part (b) and what you have learned about the properties of moment generating functions, determine whether the combined time elapsed of two independent occurrences has the same distribution as the time elapsed of one occurrence. Show all your work and explain.
d) Find the expected elapsed time using the definition of expected value. Can the MGF be used here instead to find E(C)? Why or why not?
Problem 2 - Let X1 ∼ Exp(3) and X2 ∼ Exp(3) be two independent exponential random variables. Show using the properties of moment generating functions that Y1 = X1 + X2 and Y2 = 2X1 do not have the same distributions. What are the distributions of Y1 and Y2?
Problem 3 - In this problem, you will be examining data to estimate probability tables for the joint random variables of marijuana use and dance/party participation.
You can read more about the format of the data and variable descriptions here. The study was conducted to determine if behaviour correlates with marijuana use among middle class youths and was published in 1976 (a bit outdated but interesting nonetheless!). The data is summarized below:
|
Marijuana Use
|
Party/Dance Participation
|
|
|
Nor At All
|
Somewhat
|
A Great Deal
|
Row Totals
|
|
Never
|
40
|
213
|
118
|
|
|
< 1/month
|
3
|
55
|
40
|
|
|
> 1/month
|
1
|
44
|
54
|
|
|
> 1/day
|
0
|
17
|
32
|
|
|
Col. Totals
|
|
|
|
|
a) Using the count data in this problem, how many middle class youths were surveyed? Briefly explain how you might use the data presented to estimate each joint probability? For example, how could you use these counts to estimate the proportion of middle class youths or the probability that a middle class youth somewhat uses marijuana less than once a month and participates in dance/parties a great deal?
b) Create an estimated joint probability table using the data provided. Verify that your probability sum to 1.
c) Find the marginal probability mass table for marijuana use, and briefly describe what information this table conveys.
d) What is the probability that a middle class youth that consumes marijuana daily will never participate at dance/parties?
e) Find the conditional probability mass table for dance/party participation for middle class youths who rarely (<1/month) consume marijuana.
Problem 4 - Let X be a random variable with density
fX(x) = 2e-2x, x > 0
a) Let Y = ln(X). Find the density of Y using the method of distributions.
b) Repeat (a) using the method of transformations.
Problem 5 - Two random variables X, Y are jointly distributed with probability density functions given by:
a) Sketch the graph of the support of the joint PDF. Be sure to shade the appropriate area and include appropriate labels.
b) Which of the following is the double integral required to compute P(X ≤ 1, Y ≤ 3)? Briefly explain or show with a diagram why the others are incorrect.
(i) 0∫3 0∫1 5y3/128 dx dy
(ii) 0∫3 0∫½ 5y3/128 dx dy + 0∫4-2x ½∫1 5y3/128 dx dy
(iii) 0∫3 0∫4-2x 5y3/128 dx dy
(iv) 1 - 3∫4 1∫2 5y3/128 dx dy
c) What is the probability that the X will be less than half of Y ?
d) What is the average value of X?
Problem 6 - In the hit Netflix series Stranger Things, a creature from another dimension nicknamed the demogorgon is able to move between its own dimension and the town of Hawkins. It also eats people and is drawn to the presence of blood. The gate connecting the two dimensions is located in Hawkins' Laboratory, a coordinate (0, 0) on a Cartesian plane. Two other locations of interest are: Hawkins' Middle School located 2 miles east of the laboratory at (2, 0), and the junkyard 4 miles north of the lab at the edge of the town at (0, 4). Due to the location of the gate, the demogorgon is more likely to appear in the vicinity of the laboratory than at the edges of town. Suppose the coordinates (X, Y) at which the demogorgon appears can be modeled with the following probability density function:
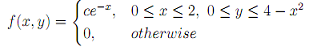
where X, Y denotes the number of miles east of the lab and north of the lab, respectively.
a) Sketch the support and label all axes and relevant boundaries. Shade in the area corresponding to the support.
b) Find the value of c for which f(x, y) will be a valid PDF. Be sure to verify any other necessary criteria.
c) Find the probability that the demogorgon appears more than 3 miles north but no more than 1 mile east of the laboratory.
d) Determine if its east and north coordinates are dependent.
e) Where would you expect the demogorgon to appear if you were able to predict that it would directly east of the laboratory? Interpret your result.
f) Set up but do not compute the integral for finding the probability that the demogorgon appears more than 1/2 mile away from the laboratory. Be sure to include appropriate probability notation for the event.
Problem 7 - A restaurant offers both reserved seating and regular drop-in seating. On a randomly selected day, R is the proportion of time spent serving diners with reservations and D is the proportion of time spent serving regular diners. The joint probability density function of (D, R) is given by:
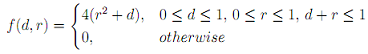
What is the probability that more than 50% of the time is spent on diners with reservations if, on a given night, they spend 20% of their time on drop in diners. Hint: Sketch out the support and use it! Keep in mind that R and D represent proportions of time, and their sum can be at most 100%.
Problem 8 - Let X ∼ N(µ, σ2).
a) Show using the transformation method that the transformation Z = X - µ/σ (the process of standardizing any normal random variable) results in a standard normal random variable. That is Z ∼ N(0, 1).
b) Let W = 9Z2 where Z is defined in (a). Find P(W ≤ 7.5).
Problem 9 - Suppose the life expectancy of house cats can be modeled with a normal distribution with an average of 14.5 years and a standard deviation of 3 years.
a) Find the central range of life expectancies of 95% of house cats. Interpret what this interval means in this context (try not to restate the question).
b) To what age do the top 2% of cats live? What percentile does this age represent? Explain what your results mean.
c) What is the probability that a randomly selected house cat will live more than 18 years?
d) What is the probability that a randomly selected house cat will live more than 18 years if we know it is already 15 years old? Justify in plain English why the result is different from (c).
e) Consider more generally a random variable X where X ∼ N(µ, σ2). Find the value of k in terms of number of standard deviations σ such that P(µ - kσ ≤ X ≤ µ + kσ) = 0.95. Comment on any similarities you notice to part (a).
f) Referring to part (d), what does the random variable Z, or your Z-scores in the normal probability table, represent in terms of µ and σ for a normal random variable X ∼ N(µ, σ2)?
g) Using X ∼ N(µ, σ2), show that P(|X - µ| < 1.50σ) = 0.8664. Find the probability P(|X -µ| < 1.50σ) using Chebyshev's inequality and compare your results. Which computation should be used if you had to choose?
Attachment:- Assignment File.rar