Assignment - Simple Classifiers
General Instructions
This assignment is individual work. You may discuss questions and problems with anyone, but the work you hand in for this assignment must be your own work.
- Each question indicates what to hand in.
- Do not submit folders, or zip files, even if you think it will help.
- Assignments must be submitted to Moodle.
Question 1:
Purpose: To practice using Variable Elimination on non-trivial examples. Consider the Bayesian network given below.
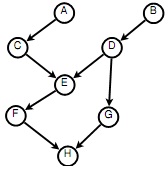
Write out a formula for each of the following queries, using technique called variable elimination shown in class. There are no probabilities given, so leave you answer in algebraic form. Choose any order for the marginalization; there is no need to determine the "optimal" order. Be sure to consider conditional independence, and relevance, as in A3!
(a) P(G|C)
(b) P (B|A, F)
Question 2:
Purpose: To work through the equations for a Linear Classifier.
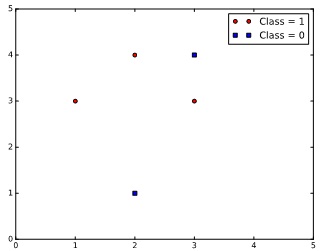
Consider the following diagram, showing 4 data points in the x1, x2 plane.
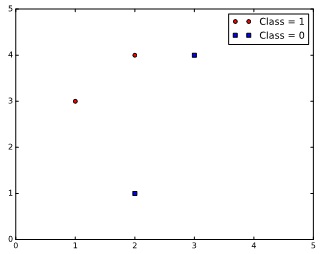
(a) Give a pair of values (m1, b1) that defines a line that separates the two classes. Use the function h() defined in the notes:
h(x1, x2, m, b) = 1 if x2 - (mx1 + b) ≥0; 0 otherwise
to demonstrate that your line separates the two classes by showing that all the points for the red class are on one side of the line, and all the points for the blue class are on the other.
(b) Take one point from the data, and use the "Perceptron Learning rule" to demonstrate the update of your choice for (m1, b1). Use an arbitrary α; it can be α = 0.1, just to keep math simple. You only need to show the change in (m1, b1) using the rule once, on one data point.
(c) Give a pair of values values (m2, b2) that defines a line that does not separate the two classes (any line where at least one point is misclassified will do). As in part (a), demonstrate that your line does not separate the two classes by showing one or more of the points from one of the classes is on the "wrong" side of the line.
(d) Take one of the misclassified points from the data (depending on your choice of (m2, b2)), and use the "Perceptron Learning rule" to demonstrate the update of your choice for (m2, b2) with that point. Use an arbitrary α; it can be α = 0.1, just to keep math simple. You only need to show the change in (m2, b2) using the rule once, on one data point.
Question 3:
Purpose: To work through the equations for a Logistic Regression Classifier. Consider the following diagram, showing 5 data points in the x1, x2 plane.
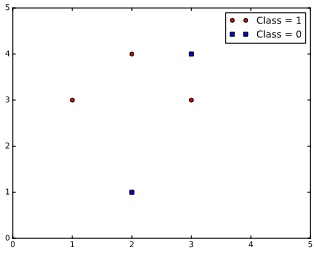
(a) Using your (m1, b1) from Question 1, demonstrate the output of the Logistic classifier on all 5 data points. Use the logistic classifier h() defined in the notes:
h2(x1, x2, m, b) = 1/(1 + e-(x2 -mx1 -b))
(b) Using the Logistic Regression Learning rule, your (m1, b1) from Question 1, and the point (3, 3), demonstrate the effect of the the learning rule by calculating the new values for (m1, b1).
Let's use v as an abbreviation:
v = h2(xi1, xi2, m, b)
The Logistic Regression Learning rule is as follows.
m = m - α xi1 (yi - v) v (1 - v)
b = b - α (yi - v) v (1 - v)
(c) Using your updated (m1, b1) from the previous part, demonstrate the output of the Logistic classifier on all 5 data points.
Question 4:
Purpose: To work through the equations of the simple perceptron classifier.
Consider the following diagram, showing 4 data points in the x1, x2 plane.
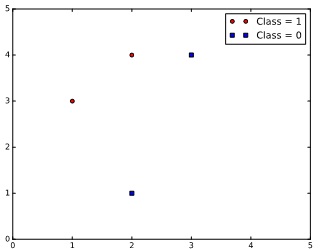
This data is the same as in Question 2.
(a) Construct a perceptron with one unit, and one output value, that correctly classifies the data.
You could use the following as your basic architecture (but you are not bound to use this one).
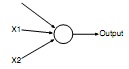
This is an exercise in understanding how perceptrons work; don't do back propagation or anything. Try to figure out how many inputs your perceptron needs, and what weights will give you the right answer as the output. Use Step as your activation function here (not Sigmoid).
Hint: Use Question 1!
(b) Demonstrate that your perceptron works correctly by showing its output on all 4 data points.
Question 5:
Purpose: To work through one step of the back propagation algorithm for Artificial Neural Networks.
Consider the following diagram, showing 5 data points in the x1, x2 plane.
This data is the same as in Question 3.
(a) Construct a 2-level feedforward neural network to classify the 5 data points. Your network should have 2 input units, and one output unit, with up to 3 weights on each unit. Use the Step function as the activation function for all units. There will be no hidden layer here.
The following is a diagram of what you could use. Note that each unit is a perceptron as in Question 3.
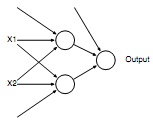
The problem is to figure out what weights to use to build this network to get all 5 data points right.
(b) Demonstrate that your ANN works correctly by showing its output on all 5 data points.