Ask Question, Ask an Expert

+61-413 786 465

info@mywordsolution.com

Ask Statistics and Probability Expert

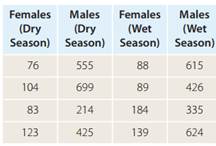
An article on spatial organization of the honey badger in the southern Kalahari, published in the Journal of Zoology in 2005, reported home range sizes in square kilometers for four females and four males (not their mates) in the dry season and then for the same badgers in the wet season.

987_spatial organization of the honey badger.png

a. If a comparison is to be made between home range sizes for females versus males, would a paired or two-sample procedure be used?

b. If a comparison is to be made between home range sizes for females versus males, should we do inference about the mean of differences or difference between means?

c. If a comparison is to be made between home range sizes in the dry versus the wet season, would a paired or a twosample procedure be used?

d. If a comparison is to be made between home range sizes in the dry versus the wet season, should we do inference about the mean of differences or the difference between means?

e. Judging from the numbers in the table, which difference is more dramatic-the one between males and females or the one between dry and wet season?

f. Use software to test if, for all female honey badgers, it is plausible that the mean of differences between home range sizes, wet minus dry season, equals zero; first report the t statistic.

g. Report the P-value for the test in part (f).

h. State your conclusion.

i. For female badgers, report a 95% confidence interval for the mean of all differences in home range sizes, wet minus dry season.

j. Use software to test if, for all males, it is plausible that the mean of differences between home range sizes, wet minus dry season, equals zero; first report the t statistic.

k. Report the P-value for the test in part (j).

l. State your conclusion.

m. For male badgers, report a 95% confidence interval for the mean of all differences in home range sizes, wet minus dry season.

n. Use software to test if the mean home range size in the dry season for all female honey badgers could equal that for all males: first report the t statistic.

o. Report the P-value for the test in part (n).

p. State your conclusion.

q. For the dry season, report a 95% confidence interval for the difference in mean home range sizes, females minus males.

r. What would the P-value in part (o) be if we suspected in advance that home range size in the dry season is greater for males than for females?

s. Use software to test if the mean home range size in the wet season for all female honey badgers could equal that for all males; first report the t statistic.

t. Report the P-value for the test in part (s).

u. State your conclusion.

v. For the wet season, report a 95% confidence interval for the difference in mean home range sizes, females minus males.

w. What would the P-value in part (t) be if we suspected in advance that home range size in the wet season is greater for males than for females?

x. Which of these apparently has a significant effect on honey badgers' home range size: type of season (wet or dry), gender, both, or neither?

y. Consider the four hypothesis tests and the four confidence intervals produced in this exercise. What can we say about the confidence intervals when the data led us to reject the null hypothesis?

z. The researchers actually had data from about twice as many badgers, with results similar to those shown in the previous table. With a bigger sample size, would the P-values for your tests be larger or smaller?

Statistics and Probability, Statistics

  • Category:- Statistics and Probability
  • Reference No.:- M92646291

Have any Question?


Related Questions in Statistics and Probability

Letnbspxbar6nbspdenote the sample mean of a

Let  X(bar) 6  denote the sample mean of a sample  X 1 ,  X 2 , ...,  X 6  from  Unif  (-1, 3). (a) What is the expected value of  X(bar) 6 ? (b) What is the variance of  X(bar) 6 ?

How can a graph or chart of data help you understand the

How can a graph or chart of data help you understand the results? What is a frequency table? Describe an example where a frequency table can be used in life.

Butterfly tractors had 1850 million in sales last year cost

Butterfly Tractors had $18.50 million in sales last year. Cost of goods sold was $8.90 million, depreciation expense was $2.90 million, interest payment on outstanding debt was $1.90 million, and the firm's tax rate was ...

Your company doesnt face any taxes and has 760 million in

Your company doesn't face any taxes and has $760 million in assets, currently financed entirely with equity. Equity is worth $51.00 per share, and book value of equity is equal to market value of equity. Also, let's assu ...

Suppose it is known that the response time of healthy

Suppose it is known that the response time of healthy subjects to a particular stimulus is a normally distributed random variable with a mean of 15 seconds and a variance of 16. What is the probability that a random samp ...

4m industries has 30 million shares outstanding trading at

4M Industries has 30 million shares outstanding trading at $20 per share. 4M also has $150 million in outstanding debt. Suppose firm's equity cost of capital is 12%, its debt cost of capital is 5%, and the corporate tax ...

Doctoral assistant ships of phd students 50 have paid

Doctoral assistant ships of Ph.D students 50% have paid assistant ships. a random sample of n=200 students is chosen.. based on this sample and using the properties of the binomial distribution, what is the approximate s ...

The local police department must write an average of 5

The local police department must write an average of 5 traffic tickets each day to keep department revenues at budgeted levels. Suppose the number of tickets written per day follows a Poisson distribution with a mean of ...

1 summary statistics for returns on two stocks x and y are

1. Summary statistics for returns on two stocks X and Y are listed below. Mean Variance Stock X 2.83% 0.006000 Stock Y 5.98% 0.003000 The covariance of returns on stocks X and Y is 0.001500. Consider a portfolio of 80% s ...

Annbspe-commerce web site claims thatnbsp8nbspof people who

An? e-commerce Web site claims that 8?% of people who visit the site make a purchase. Complete parts a through e below based on a random sample of 15 people who visited the Web site. a.  What is the probability that none ...

  • 4,153,160 Questions Asked
  • 13,132 Experts
  • 2,558,936 Questions Answered

Ask Experts for help!!

Looking for Assignment Help?

Start excelling in your Courses, Get help with Assignment

Write us your full requirement for evaluation and you will receive response within 20 minutes turnaround time.

Ask Now Help with Problems, Get a Best Answer

Why might a bank avoid the use of interest rate swaps even

Why might a bank avoid the use of interest rate swaps, even when the institution is exposed to significant interest rate

Describe the difference between zero coupon bonds and

Describe the difference between zero coupon bonds and coupon bonds. Under what conditions will a coupon bond sell at a p

Compute the present value of an annuity of 880 per year

Compute the present value of an annuity of $ 880 per year for 16 years, given a discount rate of 6 percent per annum. As

Compute the present value of an 1150 payment made in ten

Compute the present value of an $1,150 payment made in ten years when the discount rate is 12 percent. (Do not round int

Compute the present value of an annuity of 699 per year

Compute the present value of an annuity of $ 699 per year for 19 years, given a discount rate of 6 percent per annum. As