Case Scenario:
Background information:
Talking on a telephone while driving is widely regarded as a risk factor for traffic accidents. Despite legislation in many countries, including Australia, that prohibit the use of handheld mobile phone devices, many drivers continue to use handheld phones to talk and send/receive text messages while driving.
Prior research has found that talking on a mobile phone while driving changes driving behavior. There is increased mental workload required to process incoming visual or verbal information via the telephone while simultaneously interpret and appropriately respond to changing traffic conditions that result from traffic management signals (stop signs and traffic lights) and the actions of other drivers. There is also visual distraction when drivers take their attention off the road to view the telephone handset when dialing a telephone number, or reading/writing a text message. Consequently, drivers who talk on hand-held phones tend to slow their driving speeds and those who dial on hands-free phones slow down even more as a way of compensating for the detrimental effects on mental processing.
The research study:
A group of researchers were interested in further investigating the impact of mobile telephone use on car accidents. They began by accessing data from a survey previously sent out in 1997 to approximately 29,000 people who had reported a motor vehicle accident to their insurance company in the previous 12 months. There was a 31% response rate to that survey, with 9150 people returning surveys. Of these surveys, 5007 were complete enough to be used in the study. The researchers replicated the survey a decade later in 2007, sending the same survey out to approximately 33,000 people who had reported a motor vehicle accident in the previous 12 months. They had 6111 surveys returned in 2007, but only 4307 were complete enough to be used in the study.
The surveys in 1997 and 2007 asked the respondents to consider the accident they had been involved in and answer problems regarding their use of mobile phones when driving. Specifically, they were asked about: (i) if they were using a mobile phone during (or just before) the accident; the type of mobile phone (hands free or hand-held); (i) their gender, (iii) age; (iv) number of kilometers driven each year, and the (v) length of time they had held a drivers’ license.
Your task:
Information obtained from the 1997 and 2007 surveys is presented in the following tables and figure. Read each carefully and using this information and information presented in the preceding text, answer the problems below. Provide your answers in the
problem: Which of the following best describes the research problem for this study?
a) What are the reasons people drive while talking on a mobile phone?
b) How is driving while talking on a mobile phone associated with the risk of a car accident?
c) What are the costs of mobile-phone related motor vehicle accidents?
d) How effective are hands-free mobile telephones in reducing the annual incidence of car accidents?
problem: Which of the following best describes the study design used in this scenario?
a) Longitudinal cohort study
b) Cross-sectional descriptive study
c) Case-control study
d) Non-randomized experimental study
e) Correlation study
Table: Type of accidents among respondents in 1997 and 2007 who used a mobile phone during (or immediately prior to) the accident, and those who did not.
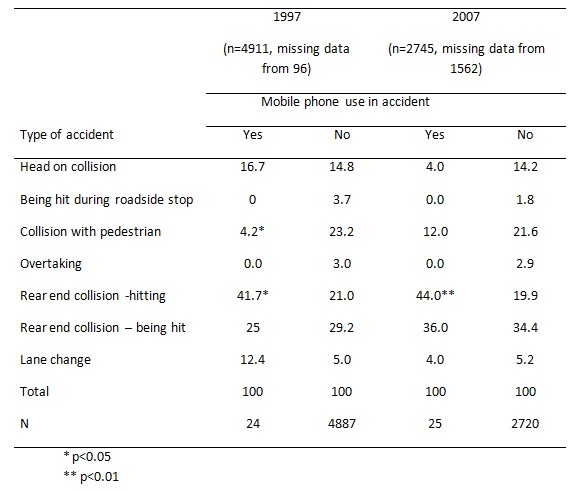
problem: Use the data presented in table above to answer the following problems.
(i) What were the total numbers of usable (complete data) survey responses in 1997 and 2007, respectively; that are reported in Table?
(ii) Using plain language, describe the number of respondents to the 1997 survey that reported using a mobile phone during (or immediately before) the accident? How did this number compare to the 2007 survey respondents?
(iii) Identify one threat to the internal validity of the data presented in this table.
problem: Using the information from figure below, answer the following problems:
Figure: At-fault drivers’ responses to the problem” Do you believe the crash could have been avoided if you hadn’t used the telephone?” Data from 1997 and 2007 combined. N=30.
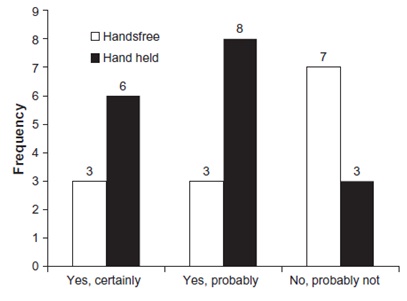
(i) What percentage of respondents (who provided usable data) believed that they could have certainly avoided the crash if they had not being driving while talking on a hand-held mobile phone?
(ii) What percentage of respondents (who provided usable data) believed that they could probably have avoided the crash if they had not being driving while talking on a hands-free mobile phone?
(iii) What percentage of respondents (who provided usable data) believed that they probably could not have avoided the crash if they had not being driving while talking on any type of mobile phone?