1. A chain of sport shops catering to beginning skiers, headquartered in Aspen, Colorado, plans to conduct a study of how much a beginning skier spends on his or her initial purchase of equipment and supplies. Based on these figures, it wants to explore the possibility of offering combinations, such as a pair of boots and a pair of skis, to induce customers to buy more. A sample of cash register receipts revealed these initial purchases:
|
$143
|
$84
|
$139
|
$161
|
$175
|
$84
|
$126
|
$149
|
$140
|
|
127
|
263
|
232
|
132
|
172
|
149
|
170
|
215
|
105
|
|
220
|
126
|
90
|
171
|
162
|
229
|
121
|
116
|
149
|
|
126
|
144
|
118
|
172
|
156
|
215
|
87
|
172
|
230
|
|
162
|
195
|
128
|
126
|
142
|
118
|
127
|
144
|
|
(a) Find the smallest class interval. Use five classes.(Round your answer to 1 decimal place. Omit the "Consider the following chartquot; sign in your response.)
(b) What would be a better class interval? (Omit the "Consider the following chartquot; sign in your response.)
(c) Organize the data into a frequency distribution using a lower limit of $80.
2. The number of families who used the Minneapolis YWCA day care service was recorded over a 30-day period. The results are as follows:
|
60
|
46
|
64
|
43
|
70
|
46
|
44
|
39
|
53
|
53
|
|
41
|
41
|
65
|
33
|
3
|
20
|
46
|
18
|
44
|
17
|
|
57
|
26
|
5
|
67
|
47
|
22
|
16
|
7
|
39
|
48
|
(a) Construct a cumulative frequency distribution of this data.
(b) Select a graph of the cumulative frequency polygon of the given data.
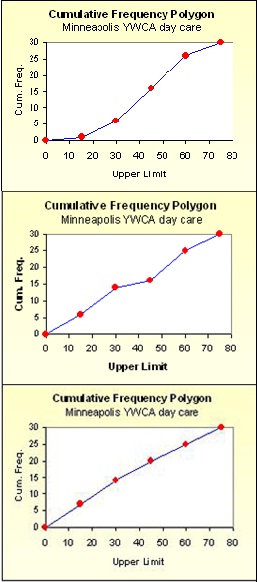
(c) How many days saw fewer than 30 families utilize the day care center?
(d) The highest 60 percent of the days had at least families.
3. JetBlue Airways is an American low-cost airline headquartered in New York City. Its main base is John F. Kennedy International Airport. JetBlue's revenue in 2001 was $621.4 million. By 2009, revenue had increased to $3,124.5 million.
What was the geometric mean annual increase for the period? (Round your answer to 2 decimal places. Omit the "%" sign in your response.)
Consider the following chart
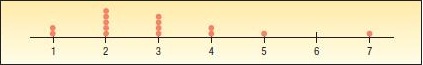
(a) What is this chart called?
(b) How many observations are in the study?
(c) What are the maximum and the minimum values?
(d) Around what values do the observations tend to cluster?
4. The first row of a stem-and-leaf chart appears as follows: 62 | 1 3 3 7 9. Assume whole number values. (The stem represents the ten's position and the leaf represents the one's position.)
(a) What is the "possible range" of the values in this row?
(b) How many data values are in this row?
(c) Select the actual values in this row of data.
621 623 623 627 629
621 623 627 623 629
621 627 623 623 629
623 621 623 629 627
5. In a study of the gasoline mileage of model year 2011 automobiles, the mean miles per gallon was 27.5 and the median was 26.8. The smallest value in the study was 12.70 miles per gallon, and the largest was 50.20. The first and third quartiles were 17.95 and 35.45 miles per gallon, respectively.
Determine the type of skewness.
Positively skewed
Negatively skewed
6. Silver Springs Moving and Storage, Inc., is studying the relationship between the number of rooms in a move and the number of labor hours required for the move. As part of the analysis the CFO of Silver Springs developed the following scatter diagram.
(a) How many moves are in the sample?
(b) Choose the correct answer.
Labor hours increase as the number of rooms decrease
Labor hours increase as the number of rooms increase
Labor hours decrease as the number of rooms increase
7. Ski Resorts of Vermont, Inc., is considering a merger with Gulf Shores Beach Resorts, Inc., of Alabama. The board of directors surveyed 50 stockholders concerning their position on the merger. The results are reported below.
|
|
Opinion
|
|
|
|
|
|
|
Number of shares held
|
Favor
|
Opposed
|
Undecided
|
Total
|
|
Under 200
|
8
|
6
|
2
|
16
|
|
200 up to 1,000
|
6
|
8
|
1
|
15
|
|
Over 1,000
|
6
|
12
|
1
|
19
|
|
|
|
|
|
|
|
Total
|
20
|
26
|
4
|
50
|
(a) What level of measurement is used in this table?
(b) What is this table called?
(c) What group seems most strongly opposed to the merger?
8. The unemployment rate in the state of Alaska by month is given in the table below:
|
Jan
|
Feb
|
Mar
|
Apr
|
May
|
Jun
|
Jul
|
Aug
|
Sep
|
Oct
|
Nov
|
Dec
|
|
7.90
|
7.10
|
7.90
|
6.70
|
6.80
|
6.60
|
8.80
|
8.70
|
8.80
|
7.90
|
7.70
|
7.20
|
(a) What is the arithmetic mean of the Alaska unemployment rates? (Round your answer to 2 decimal places.)
(b) Find the median and the mode for the unemployment rates. (Round your answers to 2 decimal places.)
9. What is the level of measurement for each of the following variables?
a. Student IQ ratings.
b. Distance students travel to class.
c. The jersey numbers of a sorority soccer team.
d. A classification of students by state of birth.
e. A ranking of students as freshman, sophomore, junior, and senior.
f. Number of hours students study per week.
10. What type of variable is the number of gallons of gasoline pumped by a filling station during a day?
Qualitative
Continuous
Attribute
Discrete
11. What type of variable is the number of robberies reported in your city?
Attribute
Continuous
Quantitative
Qualitative
12. The following frequency distribution reports the number of frequent flier miles, reported in thousands, for employees of Brumley Statistical Consulting, Inc., during the first quarter of 2007.
|
Frequent
Flier Miles
(000)
|
Number of
Employees
|
|
0 up to 4
|
5
|
|
|
4 up to 8
|
13
|
|
|
8 up to 12
|
22
|
|
|
12 up to 16
|
8
|
|
|
16 up to 20
|
2
|
|
|
|
|
|
|
Total
|
50
|
|
(a) How many employees were studied?
(b) What is the midpoint of the first class? (Round your answer to 1 decimal place.)
(d) A frequency polygon is to be drawn. What are the coordinates of the plot for the first class?
13. When data is collected using a qualitative, nominal variable, what is true about a frequency distribution that summarizes the data?
Upper and lower class limits must be calculated.
A pie chart can be used to summarize the data.
Number of classes is equal to the number of variable's values plus 2.
The "5 to the k rule" can be applied.
14. A sample of the personnel files of eight employees at the Pawnee location of Acme Carpet Cleaners, Inc., revealed that during the last six-month period they lost the following number of days due to illness:
A sample of eight employees during the same period at the Chickpee location of Acme Carpets revealed they lost the following number of days due to illness.
(a) Calculate the range, mean and mean deviations for the Pawnee location and the Chickpee location. (Round mean and mean deviation to 2 decimal places.)
(b-1) Based on the sample data, which location has fewer lost days?
(b-2) Based on the sample data, which location has less variation?