The purpose of this excise is to have you confirm empirically the relationship that theoretically should occur among alternative simple dummy variable specifications in the linear regression model. This exercise involves examining least squares coefficients in a stylized human capital model where LNWAGE is affected by years schooling (ED) and experience (EX) with slope coefficients that are identical for everyone but where the intercept term differs by race. You should conduct this exercise using the 1987 CPS Outgoing Rotation Groups data. To keep things simple you should use only the male sample.
1) Using least squares, estimate parameter estimates in the simple regression model, estimate parameters in a simple model where LNWAGE is regressed on a constant, years of schooling (ED), years of experience (EX), and years of experience squared (EXSQ). What is the value the estimated coefficient on ED? When can this coefficient be interpreted as the rate of return to a year of schooling? What is the R-squared from this model? Interpret this R-squared.
2) The specification in part 1) assumes that the intercept and slope coefficients are identical for all individuals. Now assume instead that the effect of schooling on wages differs between whites, blacks, and Hispanics; that is years of schooling (ED) and years of experience (EX) by a factor of proportionality; that is, for whites
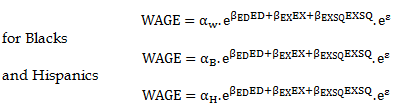
Show that this implies that when LNWAGE, rather than WAGE, is the dependent variable, white, Black, and Hispanic workers have different intercept terms but common slope coefficients. Now estimate by least squares parameters in the regression model

where BLACK is a dummy variable equal to one if the respondent is Black, HISP is a dummy variable equal to one if the respondent is Hispanic, and εis a random disturbance term. Interpret your estimates of γα, γβ, γH relatingγα, γβ, γHto αα, αβ, αHabove. Formulate and test the null hypothesis that intercept terms for white, Black, and Hispanic workers are identical, using a 5% significance level. What happens to the estimated rate of return to schooling when white, Black, and Hispanic individuals have different intercepts? Can you interpret this?
3) An alternative procedure for formulating the regression relationship in part 2) is to estimate the parameters of the equation

where WHITE is a dummy variable equal to 1 if an individual is white, 0 otherwise. Interpret θα, θβ, θH and relate them to γα, γβ, γH in part 2). According to econometric theory, what should be the relationship among the estimates of θα, θβ, θH, and γα, γβ, γH? Why? Are you estimates numerically consistent with this relationship? Why or why not? Formulate and test the null hypothesis that the intercept terms for white, Black, and Hispanic workers are identical. Your test result should be precisely equivalent to that in part 2). Is this the case? Compare the estimates of the rate of return to schooling and R-squared here with those obtained in part 2)? Are they the same? If so, why?
4) A seemingly plausible specification is the equation

In which LNWAGE is related to a common intercept term τo , to separate terms τw, τB, τH for white, Black, and Hispanic workers, and to ED and EX by common coefficients β coefficients. What is wrong with this specification? Why is least squares unable to estimate parameters of this model uniquely? What happens when you try to estimate this model using STATA? Interpret this phenomenon.
5) One other possibility is to estimate parameters in an equation in which the WHITE variable replaces the BLACK variable in the specification estimated in part 2). Such an equation would take the form

Interpret the regression coefficients δo, δw, and δH in this equation. What do you expect to be the relationship between the estimates of δo, δw, and δH and γo, γβ, γH in part 2)? Why? Verify your conjectures empirically byestimating the above equation.
6) By putting the race dummy variables into the statistical earnings function what we are doing, in essence, is removing the effect of mean differences in the independent variables on the dependent variable. One way to see this is to compute the means by race of the variables LNWAGE, ED, EX, and EXSQ. Call these means LNWAGE' , ED' , EX' , and EXSQ' for i = WHITE, BLACK, HISP. Once you do this, use these means to form new variables such that
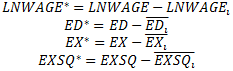
Basically, these new variables should be original variables minus the mean variable for the relevant racial group. If I were in the sample and my LNWAGE=4 and the average of LNWAGE for all Black Male workers in 1987 was 2.483037 then the value of LNWAGE' should be 4 - 2.483037. Once you have created these variables, run the following regression (make sure that you do not include an intercept term)

Verify that the coefficients on education and experience variables from this regression are equivalent to those from the previous parts of the question.
According to human capital framework there might be differences in the returns to education across different racial groups if there is racial discrimination or if different racial groups differ according to other factors such as the quality of education received, average ability, or rates of labor force participation. In the remainder of this exercise, you will take a preliminary look at this empirical issue by examining whether there are differences in returns to education across racial groups through the use of dummy variables and interaction terms.
7) Take the model you estimated in part 2) and add variables that interact BLACK and HISP with ED. In particular, using least squares procedures, estimate the parameters of the simple human capital model

Interpret the estimates of the regression coefficients βblack and βHSIP. Test the hypothesis that returns to education differ across racial groups. Do you find strong evidence that returns to education are different for whites, Blacks and Hispanics?
8) An alternative procedure for formulating the regression in part 7) is as follows. Interact the dummy variable WHITE that you created in part 3) with ED. Then estimate the following model

Interpret the Π parameters and relate them to the β parameters from part 7). What should be the relationship between the coefficients? Why? Are your estimates numerically consistent with this relationship? Formulate and test the null hypothesis that returns to education are different across racial groups? Your test should be precisely equivalent to that in part 7). Is this the case?
9) A seemingly plausible specification is the equation

What is wrong with this specification? Why is least squares unable to estimate the parameters in this model uniquely? What happens when you try to estimate this model using STATA? Interpret this phenomenon.