Ask Question, Ask an Expert

+61-413 786 465

info@mywordsolution.com

Ask Macroeconomics Expert

Part-1

1. Utilizing the link below and the instructions to follow, create a graph of the US GDP relative to Debt from the period 1981 to 2010.
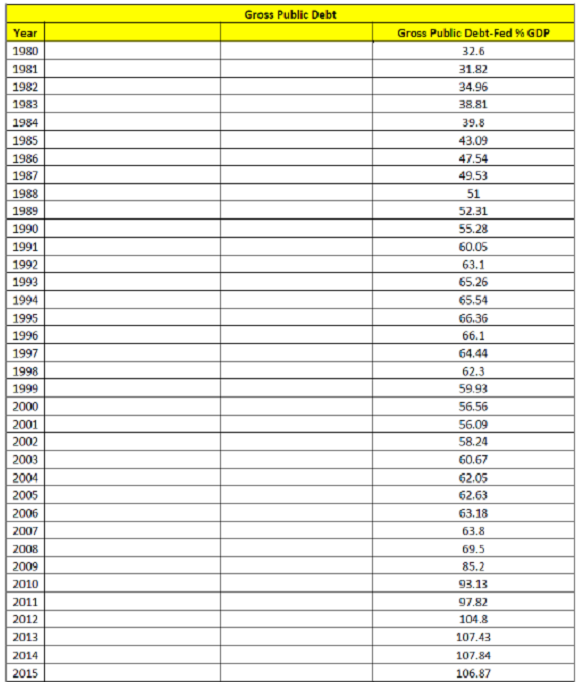
Utilizing the DATA below and the instructions to follow, create a graph of the US GDP relative to Debt from the period 1981 to 2010.

1677_create a graph of the US GDP.png

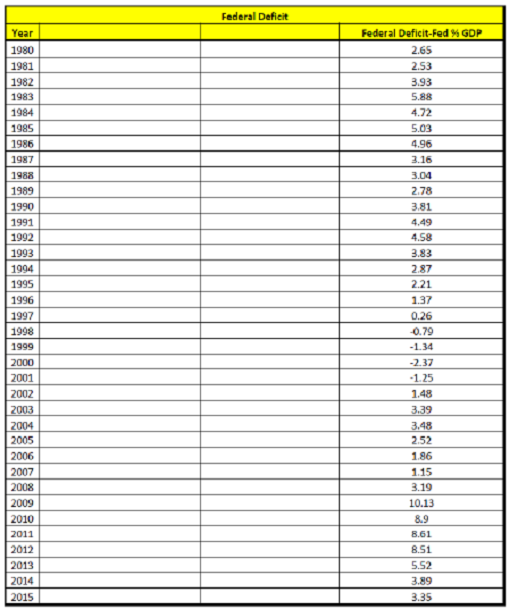
2. Utilizing the same link below, create a graph of the US GDP relative to the US deficit spending for the same 30 year period.

Ut thing the same DMA below, create a graph of the US GOP relatrre to the US clef ic it 'rendre r or the same 30 year period.
800_create a graph of the US GDP1.png

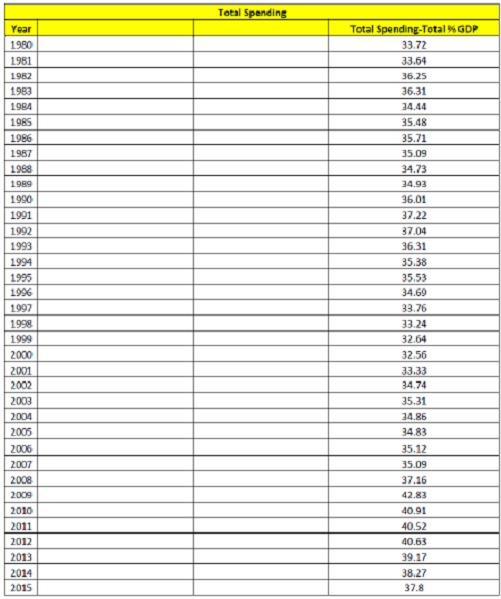
3. Utilizing the same link below, create a graph of the US GDP relative to US spending for the same 30 year period. Utilizing the same link below. a sale a graph ol the US GDP relatisse to US spending lor the tante 30 year period.
1566_create a graph of the US GDP2.png

Part 2

The next three pertain to analyzing and companng the charts from above during these time periods

1981 to 1991 1992 to 2000 2001 to 2008 2009 to 2010

Question 1:

Compare and interpret the four periods regarding the deficit spending. Focus on the changes in the percentages during each period.

Question 2:

During the specific periods above, explain the variations in the debt Give specific analysis of each period and a logical explanation of the variations.

Question 3:

Explain the Federal spending from the four periods, focus on the huge variations from 2009 and 2010 and the periods of 1981 and 1982. Also, explain the reduction in percentage of Federal spending during the 1991. to 2000 period.

Macroeconomics, Economics

  • Category:- Macroeconomics
  • Reference No.:- M9359870

Have any Question?


Related Questions in Macroeconomics

Questions 1 in country faraway cigarettes are forbidden so

Questions: 1. In Country Faraway, cigarettes are forbidden, so people trade cigarettes in a blackmarket. The cigarette demand is QD = 12 - P, and the cigarette supply is Qs = 2P. a. Find the equilibrium price and quantit ...

Question 1 graphically illustrate the minimum wage note

Question: 1) Graphically illustrate the minimum wage. Note the deadweight (welfare loss) loss and the loss or redistribution from job search. 2) Assume that you have two periods: 2011 and 2012 for a pickup truck. Price 2 ...

Topics - mergers amp acquisition capital structure stock

Topics - Mergers & Acquisition, Capital Structure, Stock Trading etc. Q1. Develop an extensive form game with imperfect information (in which one of the players can be two or more types) that models any stylized economic ...

Question - a firm has two variable factors and a production

Question - A firm has two variable factors and a production function, f(x 1 , x 2 ) = x 1 ½ x 2 ¼ . The price of its output is 4. Factor 1 receives a wage of w 1 and factor 2 receives a wage of w 2 . (a) Write an equatio ...

Question jones is one of 100000 corn farmers in a perfectly

Question: Jones is one of 100,000 corn farmers in a perfectly competitive market. What will happen to the price she can charge if: a. The rental price on all farmland increases as urbanization turns increasing amounts of ...

Introductory economics assignment -three problem-solving

Introductory Economics Assignment - Three Problem-Solving Questions. Question 1 - Australia and Canada have a free trade agreement in which, Australia exports beef to Canada. a. Draw a graph and use it to explain and ill ...

Please answer the following four discussion questions1

Please Answer The Following Four Discussion Questions 1. Explain four types of unemployment 2. Explain the advantages and disadvantages of: (a) A flexible exchange rate regime (b) A fixed exchange rate regime 3. Suppose ...

Question 1 suppose the marginal propensity to consume is 06

Question: 1. Suppose the marginal propensity to consume is 0.6, the marginal tax rate is 0.25, and the the marginal propensity to import is 0.2. What is the multiplier? 2. Suppose that in the economy described in the pre ...

Question explain why the market fails to provide optimal

Question: Explain why the market fails to provide optimal quantities of: i) Positive & negative externalities ii) Public Goods iii) Common Property Resources The response must be typed, single spaced, must be in times ne ...

Question tara is considering leaving her current job which

Question: Tara is considering leaving her current job, which pays $56,000 per year, to start a new company that manufactures a line of special pens for personal digital assistants. Based on market research, she can sell ...

  • 4,153,160 Questions Asked
  • 13,132 Experts
  • 2,558,936 Questions Answered

Ask Experts for help!!

Looking for Assignment Help?

Start excelling in your Courses, Get help with Assignment

Write us your full requirement for evaluation and you will receive response within 20 minutes turnaround time.

Ask Now Help with Problems, Get a Best Answer

Why might a bank avoid the use of interest rate swaps even

Why might a bank avoid the use of interest rate swaps, even when the institution is exposed to significant interest rate

Describe the difference between zero coupon bonds and

Describe the difference between zero coupon bonds and coupon bonds. Under what conditions will a coupon bond sell at a p

Compute the present value of an annuity of 880 per year

Compute the present value of an annuity of $ 880 per year for 16 years, given a discount rate of 6 percent per annum. As

Compute the present value of an 1150 payment made in ten

Compute the present value of an $1,150 payment made in ten years when the discount rate is 12 percent. (Do not round int

Compute the present value of an annuity of 699 per year

Compute the present value of an annuity of $ 699 per year for 19 years, given a discount rate of 6 percent per annum. As