Ask Question, Ask an Expert

+61-413 786 465

info@mywordsolution.com

Ask Macroeconomics Expert

Problem Set

Question 1:

An economy's technology is described by the following Cobb-Douglas production function.

Y = K0.50N0.50

Where, Y is the real GDP and K and N are the amounts of capital and labor. We have the following information about this economy:

Labor grows at an annual rate of 2% per year → n = 0.02
Annual depreciation rate of capital is 3% → d = 0.03
Saving rate is 25% → s = 0.25

a. Find the steady state levels of k and y. Show this case in a nice and readable Solow diagram (the graph must be fully labeled with the values of k*, y*, (d + n)×k* and s×y*.

b. If "this year" capital per worker was k = 9, at what rate would it change from "this year" to "the next year" (in other words, calculate Δk/k)? What if k was equal to 16? Show these cases in a Solow diagram. From this exercise, what do you conclude about the relationship between k and Δk/k? What is the economics behind this relationship?

Hint: Even though we did not prove it in the class, the difference between the actual investment per worker (s×y) and the one required to keep k constant ((d + n)×k)) equals the change in k. Specifically,

?k = sy - (d + n)k

c. Suppose that "this year" we are in steady state with K = 2,500 and Y = 500. Assuming steady state, if you look at this economy "next year", what will you find for the values of K, N, Y, k, and y?

Question 2:

An economy's technology is described by the following Cobb-Douglas production function.

Y = AK0.25N0.75

Where, Y is the real GDP and K and N are the amounts of capital and labor. Currently the technology parameter equals A = 16. We have the following additional information about this economy:

Labor grows at an annual rate of 1% per year → n = 0.01
Annual depreciation rate of capital is 4% → d = 0.04
Saving rate is 20% → s = 0.20

a. Find the steady state levels of k and y. For the sake of argument let's suppose that this solution pertains to the year 2016. Show this case in a nice and readable Solow diagram (the graph must be fully labeled with the values of k*2016, y*2016, (d + n)k*2016, and s × y2016.

b. Technology improves by 5% from 2016 to 2017. Find the values of k2017, y2017. Show all the shifts with the 2016 and 2017 equilibrium values in a Solow diagram.

c. Find the rates of growth of the steady-state capital per worker and GDP per worker. Show your work.

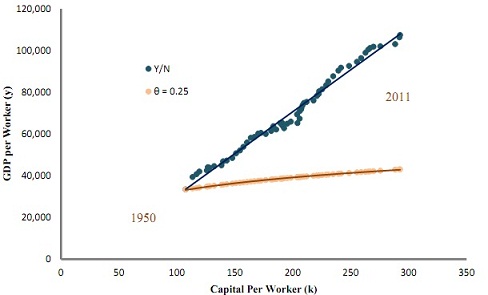
d. Now here is the cool part. Consider the graph below that you have seen several times before. It shows that, unlike what Cobb-Douglas predicts, the relationship between k and y for the U.S. was more or less linear (no diminishing returns to capital). One way to resolve this conflict was to argue that improvements in technology (know-how) had caused the function to shift up over years so that the actual (blue) points observed in the graph are the steady-state k-y pairs lying on different production functions. Assume that technology improves one more time in 2018 by the same 5%. Find the values of k*2018 and y*2018. Do the three k*-y* pairs for 2016,
2017, and 2018 lie on a straight line? If yes, what is the equation of this line?

2298_Graph.jpg

Macroeconomics, Economics

  • Category:- Macroeconomics
  • Reference No.:- M92183308
  • Price:- $110

Guranteed 48 Hours Delivery, In Price:- $110

Have any Question?


Related Questions in Macroeconomics

Question explain these questionscompare the marginal

Question: Explain these questions Compare the Marginal Revenue Curve for a firm in the PC-market with the Marginal Revenue Curve for the monopolist. Explain in your own words why a company that creates a negative externa ...

Question - the space below shows the budget constraint

Question - The space below shows the budget constraint between food (F) and non-food consumption (X). This household has $800/month to spend on the two goods, the price of food = $4/unit and PX = 1. Label both axes and b ...

Production cost analysis and estimation applied problems

Production Cost Analysis and Estimation Applied Problems - Please complete the following two applied problems: Problem 1: William is the owner of a small pizza shop and is thinking of increasing products and lowering cos ...

Question - consumer choice problems duality ii individuals

Question - Consumer choice problems (duality) II Individuals consume three breakfast goods - cereal q1, bacon q2 and eggs q3. Preferences are modelled by an indirect utility function v(p1, p2, p3, y) = y/ Root(p1(p2+p3)) ...

Question suppose that there is a natural disaster that

Question: Suppose that there is a natural disaster that destroys part of the nation's capital stock. A) Determine the effects on aggregate output, consumption, employment, and the real wage, with reference to income and ...

Question firm 1 must decide whether to enter an industry in

Question: Firm 1 must decide whether to enter an industry in which firm 2 is an incumbent. To enter this industry, firm 1 must choose to build either a plant with a small output capacity (S), or large output capacity (L) ...

Question - suppose that a consumer can earn a higher wage

Question - Suppose that a consumer can earn a higher wage rate for working overtime. That is, for the first q hours the consumer works, he or she receives a real wage rate of w1, and for hours worked more than q he or sh ...

Question janes juice bar has the following cost schedules

Question: Jane's juice bar has the following cost schedules: quantity variable cost total cost 0 vats of juice 0 30 1 10 40 2 25 55 3 45 75 4 70 100 5 100 130 6 135 165 a. calculate average variable cost, average toal co ...

Question explain which direction the below referenced

Question: Explain which direction the below referenced supply or demand curve will shift AND comment on the impact of the shift on equilibrium price and quantity. a) John, who is a clothing producer, now has to pay more ...

Question - suppose either computers or televisions can be

Question - Suppose either computers or televisions can be assembled with the following labor inputs: Units produced 1 2 3 4 5 6 7 8 9 10 Total labor used 3 7 12 15 25 33 42 54 70 90 The following production possibility c ...

  • 4,153,160 Questions Asked
  • 13,132 Experts
  • 2,558,936 Questions Answered

Ask Experts for help!!

Looking for Assignment Help?

Start excelling in your Courses, Get help with Assignment

Write us your full requirement for evaluation and you will receive response within 20 minutes turnaround time.

Ask Now Help with Problems, Get a Best Answer

Why might a bank avoid the use of interest rate swaps even

Why might a bank avoid the use of interest rate swaps, even when the institution is exposed to significant interest rate

Describe the difference between zero coupon bonds and

Describe the difference between zero coupon bonds and coupon bonds. Under what conditions will a coupon bond sell at a p

Compute the present value of an annuity of 880 per year

Compute the present value of an annuity of $ 880 per year for 16 years, given a discount rate of 6 percent per annum. As

Compute the present value of an 1150 payment made in ten

Compute the present value of an $1,150 payment made in ten years when the discount rate is 12 percent. (Do not round int

Compute the present value of an annuity of 699 per year

Compute the present value of an annuity of $ 699 per year for 19 years, given a discount rate of 6 percent per annum. As