Assignment: International Trade Policy
1. Warming up
In 1541, Francisco Vazquez de Coronado visited Quivira (Q) during his searches for the mythical "Seven Cities of Gold". You are given the task to determine whether the open- ing of Quivira to trade with the rest of the world would reveal the country to be an exporter or an importer of gold - a very important question for Francisco Vazquez de Coronado.
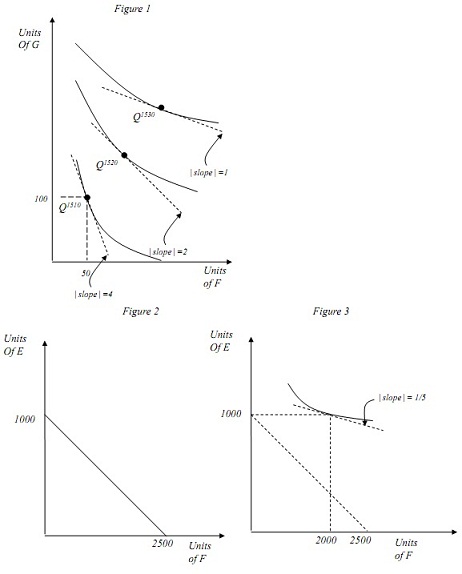
Figure 1 depicts the combination of outputs (Food (F ) and Gold (G)) produced in Quivira during each decade of a thirty year span. Also illustrated is a set of indifference curves, representing the preference of the average consumer in the country. As shown, while gold production was dismal 1510, Francisco's visit jump-started gold production in Quivira. Please answer the following questions.
(a) Based on the Figure and given these output levels, what would have been the relative prices of food (PF /PG)Q in Quivira during 1510, 1520 and 1530 in the absence of trade?
(b) Suppose that the world relative price (PF/PG)W of food has been pretty much constant throughout the three decades, with 2 and 1 being the world prices of food and gold respectively. Predict the direction of trade of Quivira with the rest of the world in these three decades. Please explain.
2. In the context of a Ricardian model, suppose that the United States has absolute ad- vantage in the production of automobiles, while France has absolute advantage in the production of coffee.
(a) AA and CA
Determine whether the following table reflects the statement above correctly. Note well that all figures below are in term of units of output that can be produced with one unit of labor. Please explain.
|
|
coffee
|
Automobiles
|
|
US
|
40
|
50
|
|
France
|
90
|
45
|
(b) In which commodity does the US have a comparative advantage? What about France? Explain.
3. Migration and Trade
Suppose that the U.S. has a homogenous work force of 4800. There are two goods: Hi- Tech and Textiles. The unit labor requirement in Hi-tech production is 6 while in textiles it is 4.
(a) Graph the Production Possibility Frontier of the U.S.
(b) What is the opportunity cost of Textiles in units of Hi-Tech products?
(c) In the absence of trade, what would be the relative price of Textiles in units of Hi-Tech products be? Why?
(d) An influx of labor thanks to an increase in immigration pressure from Mexico in- creased the size of the U.S. work force from 4800 to 6000. Will the increase in immigrant workforce contribute to the comparative advantage in Textiles of the U.S.? Please explain.
4. Aid In-Kind and Real Wages (Harder)
Here are some basic observations about a developing country, call it Utopia. There are two production sectors in Utopia, Food (F ) and Everything Else (E). The unit labor requirements in these two sectors are respectively 2 and 5. The population of laborers in Utopia is equal to 5000.
(a) Figure 2 graphs the Production Possibility Frontier of Utopia (to recall, this is just the maximal amounts of F and E that Utopians can consume in the absence of trade). What is the autarky relative price of food PF/PE in Utopia?
(b) Make use of your answer above to determine the real wages of Utopian workers in the F and E sectors respectively in the absence of trade, measured in units of E.
(c) Utopia is due to receive 2000 units of Food Aid. Continuing with the assumption of autarky, and using Figure 3 which contains additional information on consumer preferences, graph the maximal amounts of F and E that Utopians can consume accounting for Food Aid.
(d) Using Figure 3, and your answer above, what is the relative autarky price of food, accounting for Food Aid?
(e) Accordingly, demonstrate that the real wages of Utopian workers in F subsequent to receiving Food Aid is in fact half of what it used to be when Food Aid was not available.
(f) This may seem like a surprising result. Can you explain intuitively what is going on here?
5. Assessing Comparative Advantage
(a) Download the data for problem set 1 from the blackboard course web site. This is a cross-country data set of production and trade statistics across a list of manufac- turing industries. For the purpose of the problem, please select and work with one country of interest (other than the US) to you and note that down here.
(b) Use the excel worksheet provided to compute the production (in thousand US$) per unit labor for each industry and each year (1990 and 2000). Call this prodperlab. Using the data, compute the mean production per unit labor for all industries in your country.
(c) Use the excel worksheet provided to compute the production per unit labor in your industry for each industry and each year relative to the production per unit labor in the USA for each industry where data is available (1990 and 2000). Call this ratio rprodperlabUSA. List up to 3 sectors (if applicable, and less is fine if that's all you find) where the country of your choice enjoys higher production per unit labor than the USA in 1990. How has their relative productivity superiority changed by 2000?
(d) Use the excel worksheet provided to compute the export value in your country for each industry and each year relative to the export value in the USA in the same industry. Call this ratio rexpwUSA. List 3 industries (if applicable, and less is fine if that's all you find) that export more than the USA in 1990. How has their relative export superiority changed by 2000?
(e) What is the implication of the theory of comparative advantage regarding the value of rexpwUSA when rprodperlabUSA is greater than one? What about when it is less than one? Using your data (you can use scatter plots, simple regression, correlation statistics, simply a listing of relevant countries, or combinations thereof), is the data consistent with the prediction of the theory of comparative advantage?