1. In a population it is known that µx = 50 and sx2 = 36. Suppose that the following random samples were selected from this population. Use the central limit theorem to answer the following questions. Note that this question is about X-, while the previous homework (Problem 1) asked about X.
a. In a random sample of size n = 100, find Pr(X-< 51)
b. In a random sample of size n = 81, find Pr(49-<51)
c. Explain the central limit theorem in the context of the current problem, and indicate how it was useful in finding these probabilities.
2. Find the critical Z values in each of the following cases:
a. α = 0.05 (one-tailed test)
b. α = 0.05 (two-tailed test)
c. α = 0.10 (one-tailed test)
d. α = 0.01 (two-tailed test)
3. The same econometrics examination (EconS 311) was given to students at Washington State University in the two sections of the course (note that all students had the same access to exams from prior semesters and were given exactly the same amount of time to take the exam). The results from this past fall semester are as follows:
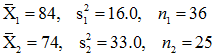
where the X- denote the grade averages in the two samples (i=1 for Section 1 and i=2 for Section 2); the si2, the two sample variances; and the ni, the two sample sizes.
- Test the hypothesis (at a=.10 level) that the population variances of the test scores for the two sections are the same? Be specific about the null and alternative hypotheses and show the steps of your test and indicate your conclusion.
- Explain your conclusion, in layman's terms (to a non-statistician).
4. Sports economists analyze win percentages of various sports teams in order to make economic recommendations to the team or league (or to make predictions for personal benefit). In this problem we will be using a dataset containing (football) win percentages of the Seattle Seahawks and the Green Bay Packers (total win percentage for the season, and at-home versus on-the-road (away) for the season). The dataset includes information for the regular-season games from 1976 through 2013. The data is in the Homework Assignment #5 folder on Angel. FOR THIS PROBLEM YOU WILL ONLY USE THE DATA FOR 1997 - 2013.
Use STATA to answer the following questions, using a confidence level of 95%. Be careful to use the appropriate one-tailed or two-tailed test as suggested by each problem component. For each, state the null and alternative hypotheses that you are testing and show the steps of your test and your conclusion. Either copy the needed STATA results on your homework page or print out your STATA results and indicate what specific information you are using in your answer.
a. Do the Seahawks have an overall winning season recordfor 1997-2013 (win percentage is significantly greater than .5)? Hint: Is this a one-tailed or two-tailed test?
- Do the Packers have an overall winning season record for 1997-2013?
- What are the sample mean win percentages records for the Seahawks and the Packers? Do your hypothesis test results from a. and b. appear consistent with the sample means? If not, why do you think that your hypothesis test results are what your reported in a. and b.?
- Do the Packers have a significantly higher overall win percentage record than Seahawks for 1997-2013?
- Do the Seahawks have a significantly higher win percentage record at home than on the road for 1997-2013?
- Do the Packers have a significantly higher win percentage record on the road than at home for 1997-2013?